Simulated dataset
# Install vjsim if you haven't already by running the following commands
# install.packages("devtools")
# devtools::install_github("mladenjovanovic/vjsim")

# Install bmbstats if you haven't already by running the following commands
# devtools::install_github("mladenjovanovic/bmbstats")

# Install tidyverse and cowplot packages
# install.packages(c("tidyverse", "cowplot", "DT", "ggdendro", "ClustOfVar", "vip", "pdp"), dependencies = TRUE)

library(vjsim)
library(tidyverse)
library(cowplot)
library(DT)
library(ggdendro)
library(ClustOfVar)
library(vip)
library(pdp)
library(bmbstats)
Before reading this vignette, please read Introduction to vjsim, Simulation in vjsim, Profiling in vjsim, and Optimization in vjsim vignettes by running:
vignette("introduction-vjsim")
vignette("simulation-vjsim")
vignette("profiling-vjsim")
vignette("optimization-vjsim")
To explore various assumptions and models, I have generated a large simulation dataset (source code is available in data-raw/ folder of the vjsim package or through GitHub) which features various combinations of Force Generator characteristics and thus allows to explore various assumptions. Here is the sample (100 rows) of the data set:
data("vjsim_data")

datatable(vjsim_data[sample(nrow(vjsim_data), 100), ], rownames = FALSE) %>%
  formatRound(columns = 1:ncol(vjsim_data), digits = 2)
Full data set features 8640 rows and 194 columns (or variables) that are grouped in the following sections:
- Force Generator characteristics and movement constraints (column names start with
force_generator.; first 7 columns are Force Generator characteristics). This also included Samozino’s optimization models for the Force Generator. - Bodyweight jump metrics (column names start with
bodyweight_jump.) - Probing data (column names start with
probe_bodyweight_jump.), which includes effects on bodyweight jump metrics when max force, max velocity, or time to max activation characteristics of the Force Generator change by 10%. These column are very important for testing predictions of optimization models. - Bosco Index (column names start with
bosco.) indicated the jump height with 2xBW and the ratio with BW jump - Various Force-Velocity profiles (column names start with
profile_). See Profiling in vjsim vignette for more info. - Load~Peak Force profile (column names start with
LPF_profile.). See Optimization in vjsim vignette for more info. - Theoretical and practical Samozino profiles (column names start with
samozino_). See Optimization in vjsim vignette for more info. - Simple optimization profiles (column names start with
simple_profile.). See Optimization in vjsim vignette for more info.
Here is the list of all the columns in this data set:
colnames(vjsim_data)
#>   [1] "force_generator.bodyweight"
#>   [2] "force_generator.push_off_distance"
#>   [3] "force_generator.max_force"
#>   [4] "force_generator.max_velocity"
#>   [5] "force_generator.decline_rate"
#>   [6] "force_generator.peak_location"
#>   [7] "force_generator.time_to_max_activation"
#>   [8] "force_generator.F0"
#>   [9] "force_generator.F0_rel"
#>  [10] "force_generator.V0"
#>  [11] "force_generator.Pmax"
#>  [12] "force_generator.Pmax_rel"
#>  [13] "force_generator.Sfv"
#>  [14] "force_generator.Sfv_rel"
#>  [15] "force_generator.take_off_velocity"
#>  [16] "force_generator.height"
#>  [17] "force_generator.optimal_F0"
#>  [18] "force_generator.optimal_F0_rel"
#>  [19] "force_generator.optimal_V0"
#>  [20] "force_generator.optimal_height"
#>  [21] "force_generator.optimal_height_diff"
#>  [22] "force_generator.optimal_height_ratio"
#>  [23] "force_generator.optimal_Pmax"
#>  [24] "force_generator.optimal_Pmax_rel"
#>  [25] "force_generator.optimal_take_off_velocity"
#>  [26] "force_generator.optimal_take_off_velocity_diff"
#>  [27] "force_generator.optimal_take_off_velocity_ratio"
#>  [28] "force_generator.optimal_Sfv"
#>  [29] "force_generator.optimal_Sfv_rel"
#>  [30] "force_generator.Sfv_perc"
#>  [31] "force_generator.FV_imbalance"
#>  [32] "force_generator.probe_IMB"
#>  [33] "bodyweight_jump.take_off_time"
#>  [34] "bodyweight_jump.take_off_velocity"
#>  [35] "bodyweight_jump.height"
#>  [36] "bodyweight_jump.mean_GRF_over_distance"
#>  [37] "bodyweight_jump.mean_GRF_over_time"
#>  [38] "bodyweight_jump.mean_velocity"
#>  [39] "bodyweight_jump.work_done"
#>  [40] "bodyweight_jump.impulse"
#>  [41] "bodyweight_jump.mean_power"
#>  [42] "bodyweight_jump.mean_RFD"
#>  [43] "bodyweight_jump.mean_RPD"
#>  [44] "bodyweight_jump.peak_GRF"
#>  [45] "bodyweight_jump.peak_GRF_time"
#>  [46] "bodyweight_jump.peak_GRF_distance"
#>  [47] "bodyweight_jump.peak_velocity"
#>  [48] "bodyweight_jump.peak_velocity_time"
#>  [49] "bodyweight_jump.peak_velocity_distance"
#>  [50] "bodyweight_jump.peak_power"
#>  [51] "bodyweight_jump.peak_power_distance"
#>  [52] "bodyweight_jump.peak_power_time"
#>  [53] "bodyweight_jump.peak_RFD"
#>  [54] "bodyweight_jump.peak_RFD_distance"
#>  [55] "bodyweight_jump.peak_RFD_time"
#>  [56] "bodyweight_jump.GRF_at_100ms"
#>  [57] "bodyweight_jump.GRF_at_200ms"
#>  [58] "bodyweight_jump.peak_RPD"
#>  [59] "bodyweight_jump.peak_RPD_distance"
#>  [60] "bodyweight_jump.peak_RPD_time"
#>  [61] "bodyweight_jump.diff_peak_to_take_off_velocity"
#>  [62] "bodyweight_jump.ratio_peak_to_take_off_velocity"
#>  [63] "bodyweight_jump.diff_mean_to_take_off_velocity"
#>  [64] "bodyweight_jump.ratio_mean_to_take_off_velocity"
#>  [65] "bodyweight_jump.diff_mean_to_peak_velocity"
#>  [66] "bodyweight_jump.ratio_mean_to_peak_velocity"
#>  [67] "bodyweight_jump.diff_mean_to_peak_power"
#>  [68] "bodyweight_jump.ratio_mean_to_peak_power"
#>  [69] "bodyweight_jump.diff_mean_GRF_over_distance_to_time"
#>  [70] "bodyweight_jump.ratio_mean_GRF_over_distance_to_time"
#>  [71] "bodyweight_jump.mean_velocity_as_TOV_half"
#>  [72] "probe_bodyweight_jump.force_height"
#>  [73] "probe_bodyweight_jump.force_height_diff"
#>  [74] "probe_bodyweight_jump.force_height_ratio"
#>  [75] "probe_bodyweight_jump.velocity_height"
#>  [76] "probe_bodyweight_jump.velocity_height_diff"
#>  [77] "probe_bodyweight_jump.velocity_height_ratio"
#>  [78] "probe_bodyweight_jump.activation_height"
#>  [79] "probe_bodyweight_jump.activation_height_diff"
#>  [80] "probe_bodyweight_jump.activation_height_ratio"
#>  [81] "probe_bodyweight_jump.velocity_to_force_height_diff"
#>  [82] "probe_bodyweight_jump.velocity_to_force_height_ratio"
#>  [83] "probe_bodyweight_jump.velocity_to_activation_height_diff"
#>  [84] "probe_bodyweight_jump.velocity_to_activation_height_ratio"
#>  [85] "probe_bodyweight_jump.force_to_velocity_height_diff"
#>  [86] "probe_bodyweight_jump.force_to_velocity_height_ratio"
#>  [87] "probe_bodyweight_jump.force_to_activation_height_diff"
#>  [88] "probe_bodyweight_jump.force_to_activation_height_ratio"
#>  [89] "probe_bodyweight_jump.activation_to_velocity_height_diff"
#>  [90] "probe_bodyweight_jump.activation_to_velocity_height_ratio"
#>  [91] "probe_bodyweight_jump.activation_to_force_height_diff"
#>  [92] "probe_bodyweight_jump.activation_to_force_height_ratio"
#>  [93] "bosco.height_2BW"
#>  [94] "bosco.index"
#>  [95] "profile_mean_FV.F0"
#>  [96] "profile_mean_FV.F0_rel"
#>  [97] "profile_mean_FV.V0"
#>  [98] "profile_mean_FV.Pmax"
#>  [99] "profile_mean_FV.Pmax_rel"
#> [100] "profile_mean_FV.Sfv"
#> [101] "profile_mean_FV.Sfv_rel"
#> [102] "profile_mean_power.Pmax"
#> [103] "profile_mean_power.Pmax_rel"
#> [104] "profile_mean_power.Pmax_location"
#> [105] "profile_mean_power.F0_perc"
#> [106] "profile_peak_FV.F0"
#> [107] "profile_peak_FV.F0_rel"
#> [108] "profile_peak_FV.V0"
#> [109] "profile_peak_FV.Pmax"
#> [110] "profile_peak_FV.Pmax_rel"
#> [111] "profile_peak_FV.Sfv"
#> [112] "profile_peak_FV.Sfv_rel"
#> [113] "profile_peak_power.Pmax"
#> [114] "profile_peak_power.Pmax_rel"
#> [115] "profile_peak_power.Pmax_location"
#> [116] "profile_peak_power.F0_perc"
#> [117] "profile_load_take_off_velocity.V0"
#> [118] "profile_load_take_off_velocity.L0"
#> [119] "profile_load_take_off_velocity.L0_rel"
#> [120] "profile_load_take_off_velocity.Imax"
#> [121] "profile_load_take_off_velocity.Imax_rel"
#> [122] "profile_load_take_off_velocity.Slv"
#> [123] "profile_load_take_off_velocity.Slv_rel"
#> [124] "profile_load_impulse.Imax"
#> [125] "profile_load_impulse.Imax_rel"
#> [126] "profile_load_impulse.Imax_location"
#> [127] "profile_load_impulse.L0_perc"
#> [128] "LPF_profile.slope"
#> [129] "LPF_profile.slope_rel"
#> [130] "samozino_theoretical_profile.F0"
#> [131] "samozino_theoretical_profile.F0_rel"
#> [132] "samozino_theoretical_profile.V0"
#> [133] "samozino_theoretical_profile.Pmax"
#> [134] "samozino_theoretical_profile.Pmax_rel"
#> [135] "samozino_theoretical_profile.Sfv"
#> [136] "samozino_theoretical_profile.Sfv_rel"
#> [137] "samozino_theoretical_profile.take_off_velocity"
#> [138] "samozino_theoretical_profile.height"
#> [139] "samozino_theoretical_profile.optimal_F0"
#> [140] "samozino_theoretical_profile.optimal_F0_rel"
#> [141] "samozino_theoretical_profile.optimal_V0"
#> [142] "samozino_theoretical_profile.optimal_height"
#> [143] "samozino_theoretical_profile.optimal_height_diff"
#> [144] "samozino_theoretical_profile.optimal_height_ratio"
#> [145] "samozino_theoretical_profile.optimal_Pmax"
#> [146] "samozino_theoretical_profile.optimal_Pmax_rel"
#> [147] "samozino_theoretical_profile.optimal_take_off_velocity"
#> [148] "samozino_theoretical_profile.optimal_take_off_velocity_diff"
#> [149] "samozino_theoretical_profile.optimal_take_off_velocity_ratio"
#> [150] "samozino_theoretical_profile.optimal_Sfv"
#> [151] "samozino_theoretical_profile.optimal_Sfv_rel"
#> [152] "samozino_theoretical_profile.Sfv_perc"
#> [153] "samozino_theoretical_profile.FV_imbalance"
#> [154] "samozino_theoretical_profile.probe_IMB"
#> [155] "samozino_practical_profile.F0"
#> [156] "samozino_practical_profile.F0_rel"
#> [157] "samozino_practical_profile.V0"
#> [158] "samozino_practical_profile.Pmax"
#> [159] "samozino_practical_profile.Pmax_rel"
#> [160] "samozino_practical_profile.Sfv"
#> [161] "samozino_practical_profile.Sfv_rel"
#> [162] "samozino_practical_profile.take_off_velocity"
#> [163] "samozino_practical_profile.height"
#> [164] "samozino_practical_profile.optimal_F0"
#> [165] "samozino_practical_profile.optimal_F0_rel"
#> [166] "samozino_practical_profile.optimal_V0"
#> [167] "samozino_practical_profile.optimal_height"
#> [168] "samozino_practical_profile.optimal_height_diff"
#> [169] "samozino_practical_profile.optimal_height_ratio"
#> [170] "samozino_practical_profile.optimal_Pmax"
#> [171] "samozino_practical_profile.optimal_Pmax_rel"
#> [172] "samozino_practical_profile.optimal_take_off_velocity"
#> [173] "samozino_practical_profile.optimal_take_off_velocity_diff"
#> [174] "samozino_practical_profile.optimal_take_off_velocity_ratio"
#> [175] "samozino_practical_profile.optimal_Sfv"
#> [176] "samozino_practical_profile.optimal_Sfv_rel"
#> [177] "samozino_practical_profile.Sfv_perc"
#> [178] "samozino_practical_profile.FV_imbalance"
#> [179] "samozino_practical_profile.probe_IMB"
#> [180] "simple_profile.L0"
#> [181] "simple_profile.TOV0"
#> [182] "simple_profile.Sfv"
#> [183] "simple_profile.Sfv_rel"
#> [184] "simple_profile.take_off_velocity"
#> [185] "simple_profile.height"
#> [186] "simple_profile.optimal_L0"
#> [187] "simple_profile.optimal_TOV0"
#> [188] "simple_profile.optimal_Sfv"
#> [189] "simple_profile.optimal_Sfv_rel"
#> [190] "simple_profile.optimal_take_off_velocity"
#> [191] "simple_profile.optimal_height"
#> [192] "simple_profile.Sfv_perc"
#> [193] "simple_profile.FV_imbalance"
#> [194] "simple_profile.probe_IMB"
This data set can be used for multiple things: from exploring simple relationships between variables, to performing variable clustering and factor analysis as well for informing future studies. I will provide few ideas to get you started and finish with my summary opinion on the Samozino optimization models (Samozino et al. 2008, 2010, 2012, 2013; Pierre Samozino 2018b, 2018a, 2018a) and the most recent intervention studies (Jiménez-Reyes et al. 2017; Jiménez-Reyes, Samozino, and Morin 2019).
Exploring kinematics
This section will provide simple scatter-plots and linear regression models. Before we start, let’s create a plotting and analysis function. This function will return ggplot object and \(R^2\) using simple linear model.
plot_relationship <- function(x_var, y_var, data = vjsim_data, identity = FALSE) {
  df <- data.frame(
    x_var = data[[x_var]],
    y_var = data[[y_var]]
  )

  gg <- ggplot(df, aes(x = x_var, y = y_var)) +
    theme_cowplot(8) +
    geom_point(alpha = 0.1) +
    stat_smooth(color = "blue", method = "lm", formula = y ~ x) +
    labs(x = x_var, y = y_var)

  if (identity == TRUE) {
    gg <- gg +
      geom_abline(slope = 1, linetype = "dashed")
  }

  # Linear model
  R_squared <- cor(df$x_var, df$y_var)^2

  return(list(graph = gg, R_squared = R_squared))
}
Samozino model assumes that take-off velocity (TOV) is double mean velocity (MV) (it is simplification that allows for easier calculus from practical field data collection). But is that the case? Here is the :
mv_tov <- plot_relationship(
  "bodyweight_jump.mean_velocity",
  "bodyweight_jump.take_off_velocity"
)

mv_tov$graph + geom_abline(slope = 2, linetype = "dashed")

mv_tov$R_squared
#> [1] 0.500241
Another assumption is that mean ground reaction force (GRF) over distance is equal to mean GRF over time (which is the case with uniform acceleration jump, when TOV = 2x MV). Let’s check that assumption:
plot_relationship(
  "bodyweight_jump.mean_GRF_over_distance",
  "bodyweight_jump.mean_GRF_over_time",
  identity = TRUE
)
#> $graph

#>
#> $R_squared
#> [1] 0.9167995
As can be seen from the figure above, there is a difference between the two and they should not be used interchangeably.
Let’s compare the true bodyweight jump height with predicted jump height with two Samozino models (theoretical and practical):
plot_relationship(
  "bodyweight_jump.height",
  "samozino_theoretical_profile.height",
  identity = TRUE
)
#> $graph

#>
#> $R_squared
#> [1] 0.7808933
As can be seen, theoretical model (the one that uses true mean velocity) is not very good at predicting bodyweight jump height. Practical Samozino (or the original one), one the other hand is very good:
plot_relationship(
  "bodyweight_jump.height",
  "samozino_practical_profile.height",
  identity = TRUE
)
#> $graph

#>
#> $R_squared
#> [1] 0.9999803
It is thus my recommendation to Samozino et al. to avoid using mean velocity in the profile, and rather stick to TOV instead. This way the unnecessary assumptions doesn’t need to be applied and optimization procedure becomes less confusing.
Explore profiles
One of my main issues with Samozino model, is the realist ontological perspective on the constructs (\(F_0\), \(V_0\), and \(P_{max}\)) (Borsboom 2008, 2009; Borsboom, Mellenbergh, and van Heerden 2003). In plain English, the assumption is that constructs estimated using manifested performance represent true characteristics of the lower body (i.e., Force Generator). But, we have already seen that these constructs depends on the push-off distance and other Force Generator characteristics simulated in vjsim (e.g., time to max activation, force-length relationship). In real-life, these manifestations depend on the activity as well (e.g., jumping, sprinting). Let’s explore those relationships a bit further.
Let’s see how true max force of the Force Generator is related to estimated \(F_0\)s.
plot_relationship(
  "force_generator.max_force",
  "profile_mean_FV.F0",
  identity = TRUE
)
#> $graph

#>
#> $R_squared
#> [1] 0.6790944plot_relationship( "force_generator.max_force", "profile_peak_FV.F0", identity = TRUE ) #> $graph

#>
#> $R_squared
#> [1] 0.7941104plot_relationship( "force_generator.max_force", "samozino_practical_profile.F0", identity = TRUE ) #> $graph

#>
#> $R_squared
#> [1] 0.9406742
Interestingly, practical Samozino profile has really good relationship between true max force of the Force Generator (although there is some systematic bias). Let’s write a multiple linear regression function, than create a regression model from multiple predictors (with or without interaction). Besides, this functions allows for variable importance estimation (Greenwell, Boehmke, and McCarthy 2018; Molnar 2018) as well as PDP and ICE plots (Goldstein et al. 2013; Molnar 2018; Greenwell 2017; Altmann et al. 2019). This function defines smallest effect size of interest (SESOI) using target variable \(SD\) times 0.2. This provides an insight into how practically good the predictions are. The plots are made using bmbstats::plot_pair_BA (Jovanović 2020b, 2019, 2020a).
regression_model <- function(data, target, predictors, interactions = FALSE, var_imp = "firm") {
  model_df <- select_(data, .dots = c(
    target,
    predictors
  ))

  interactions_string <- "~."
  if (interactions) interactions_string <- "~.*."

  model <- lm(as.formula(paste(target, interactions_string)), data = model_df)

  # Plot
  SESOI_upper <- sd(model_df[[target]]) * 0.2
  SESOI_lower <- -sd(model_df[[target]]) * 0.2

  predicted_target_val <- predict(model)

  observed_target_val <- model_df[[target]]

  gg <- bmbstats::plot_pair_BA(
    predictor = observed_target_val,
    outcome = predicted_target_val,
    predictor_label = "Predicted",
    outcome_label = "Observed",
    SESOI_lower = SESOI_lower,
    SESOI_upper = SESOI_upper
  )

  # Variable importance
  pfun <- function(object, newdata) predict(object, newdata = newdata)

  variable_importance <- vip(
    model,
    train = model_df,
    method = var_imp,
    target = target,
    nsim = 10,
    metric = "rmse",
    pred_wrapper = pfun,
    all_permutations = TRUE
  ) +
    theme_cowplot(8)

  # Return object
  return(list(
    train = model_df,
    model = model,
    summary = summary(model),
    graph = gg,
    var_imp = variable_importance
  ))
}

# --------------------------------------------
# PDP_ICE plot
plot_pdp <- function(object, predictor = 2) {
  # PDP + ICE
  partial(
    object$model,
    train = object$train,
    pred.var = predictor,
    plot = TRUE,
    rug = FALSE,
    ice = TRUE,
    plot.engine = "ggplot2",
    alpha = 0.01,
  ) +
    theme_cowplot(8) +
    ylab(paste("Predicted", colnames(object$train)[1]))
}
Let’s check if we can predict (ideally we want to predict on unseen data, but we will leave that out (Jovanović 2020b, 2019)) max force from estimated \(F_0\), bodyweight and push-off distance:
max_force_model <- regression_model(
  data = vjsim_data,
  target = "force_generator.max_force",
  predictors = c(
    "force_generator.bodyweight",
    "force_generator.push_off_distance",
    "samozino_practical_profile.F0"
  ),
  interactions = TRUE, var_imp = "firm"
)

max_force_model$summary
#>
#> Call:
#> lm(formula = as.formula(paste(target, interactions_string)),
#>     data = model_df)
#>
#> Residuals:
#>     Min      1Q  Median      3Q     Max
#> -485.60  -94.40  -12.67   68.75  612.16
#>
#> Coefficients:
#>                                                                   Estimate
#> (Intercept)                                                      2.364e-10
#> force_generator.bodyweight                                       1.693e+01
#> force_generator.push_off_distance                               -3.449e-10
#> samozino_practical_profile.F0                                    6.328e-01
#> force_generator.bodyweight:force_generator.push_off_distance    -1.510e+01
#> force_generator.bodyweight:samozino_practical_profile.F0         4.245e-16
#> force_generator.push_off_distance:samozino_practical_profile.F0  4.210e-01
#>                                                                 Std. Error
#> (Intercept)                                                      5.070e+01
#> force_generator.bodyweight                                       9.549e-01
#> force_generator.push_off_distance                                9.564e+01
#> samozino_practical_profile.F0                                    2.082e-02
#> force_generator.bodyweight:force_generator.push_off_distance     2.084e+00
#> force_generator.bodyweight:samozino_practical_profile.F0         1.711e-04
#> force_generator.push_off_distance:samozino_practical_profile.F0  4.049e-02
#>                                                                 t value
#> (Intercept)                                                       0.000
#> force_generator.bodyweight                                       17.728
#> force_generator.push_off_distance                                 0.000
#> samozino_practical_profile.F0                                    30.388
#> force_generator.bodyweight:force_generator.push_off_distance     -7.245
#> force_generator.bodyweight:samozino_practical_profile.F0          0.000
#> force_generator.push_off_distance:samozino_practical_profile.F0  10.397
#>                                                                 Pr(>|t|)
#> (Intercept)                                                            1
#> force_generator.bodyweight                                       < 2e-16 ***
#> force_generator.push_off_distance                                      1
#> samozino_practical_profile.F0                                    < 2e-16 ***
#> force_generator.bodyweight:force_generator.push_off_distance    4.68e-13 ***
#> force_generator.bodyweight:samozino_practical_profile.F0               1
#> force_generator.push_off_distance:samozino_practical_profile.F0  < 2e-16 ***
#> ---
#> Signif. codes:  0 '***' 0.001 '**' 0.01 '*' 0.05 '.' 0.1 ' ' 1
#>
#> Residual standard error: 143.7 on 8633 degrees of freedom
#> Multiple R-squared:  0.9604, Adjusted R-squared:  0.9603
#> F-statistic: 3.486e+04 on 6 and 8633 DF,  p-value: < 2.2e-16
max_force_model$graph

max_force_model$var_imp

plot_pdp(max_force_model, "samozino_practical_profile.F0")

plot_pdp(max_force_model, "force_generator.bodyweight")

plot_pdp(max_force_model, "force_generator.push_off_distance")

Although high \(R^2\), using SESOI, this model is not great for predicting max force. But it is indeed highly correlated. From the variable importance graph, it can be seen that samozino_practical_profile.F0 is the most important variable, followed by bodyweight and push-off distance. This can be seen from the PDP+ICE plots as well (these are used to estimate the variable importance using algorithm explained in Greenwell, Boehmke, and McCarthy (2018)).
Let’s see the situation with velocity:
plot_relationship(
  "force_generator.max_velocity",
  "profile_mean_FV.V0",
  identity = TRUE
)
#> $graph

#>
#> $R_squared
#> [1] 0.461428plot_relationship( "force_generator.max_velocity", "profile_peak_FV.V0", identity = TRUE ) #> $graph

#>
#> $R_squared
#> [1] 0.5961357plot_relationship( "force_generator.max_velocity", "samozino_practical_profile.V0", identity = TRUE ) #> $graph

#>
#> $R_squared
#> [1] 0.9587938
Although there is high \(R^2\), there is big systematic bias involved. Let’s see if we can predict max velocity from samozino_practical_profile.V0, bodyweight and push-off distance:
max_velocity_model <- regression_model(
  data = vjsim_data,
  target = "force_generator.max_velocity",
  predictors = c(
    "force_generator.bodyweight",
    "force_generator.push_off_distance",
    "samozino_practical_profile.V0"
  ),
  interactions = TRUE, var_imp = "firm"
)

max_velocity_model$summary
#>
#> Call:
#> lm(formula = as.formula(paste(target, interactions_string)),
#>     data = model_df)
#>
#> Residuals:
#>      Min       1Q   Median       3Q      Max
#> -1.09390 -0.15821 -0.04927  0.07373  2.01467
#>
#> Coefficients:
#>                                                                   Estimate
#> (Intercept)                                                      3.907e-01
#> force_generator.bodyweight                                      -1.410e-16
#> force_generator.push_off_distance                                2.921e-01
#> samozino_practical_profile.V0                                    1.589e+00
#> force_generator.bodyweight:force_generator.push_off_distance     3.971e-16
#> force_generator.bodyweight:samozino_practical_profile.V0         1.562e-17
#> force_generator.push_off_distance:samozino_practical_profile.V0 -3.177e-01
#>                                                                 Std. Error
#> (Intercept)                                                      1.109e-01
#> force_generator.bodyweight                                       1.428e-03
#> force_generator.push_off_distance                                2.521e-01
#> samozino_practical_profile.V0                                    2.283e-02
#> force_generator.bodyweight:force_generator.push_off_distance     3.191e-03
#> force_generator.bodyweight:samozino_practical_profile.V0         2.273e-04
#> force_generator.push_off_distance:samozino_practical_profile.V0  3.960e-02
#>                                                                 t value
#> (Intercept)                                                       3.523
#> force_generator.bodyweight                                        0.000
#> force_generator.push_off_distance                                 1.159
#> samozino_practical_profile.V0                                    69.592
#> force_generator.bodyweight:force_generator.push_off_distance      0.000
#> force_generator.bodyweight:samozino_practical_profile.V0          0.000
#> force_generator.push_off_distance:samozino_practical_profile.V0  -8.023
#>                                                                 Pr(>|t|)
#> (Intercept)                                                     0.000428 ***
#> force_generator.bodyweight                                      1.000000
#> force_generator.push_off_distance                               0.246662
#> samozino_practical_profile.V0                                    < 2e-16 ***
#> force_generator.bodyweight:force_generator.push_off_distance    1.000000
#> force_generator.bodyweight:samozino_practical_profile.V0        1.000000
#> force_generator.push_off_distance:samozino_practical_profile.V0 1.17e-15 ***
#> ---
#> Signif. codes:  0 '***' 0.001 '**' 0.01 '*' 0.05 '.' 0.1 ' ' 1
#>
#> Residual standard error: 0.3424 on 8633 degrees of freedom
#> Multiple R-squared:  0.9598, Adjusted R-squared:  0.9598
#> F-statistic: 3.439e+04 on 6 and 8633 DF,  p-value: < 2.2e-16
max_velocity_model$graph

max_velocity_model$var_imp

plot_pdp(max_velocity_model, "samozino_practical_profile.V0")

plot_pdp(max_velocity_model, "force_generator.bodyweight")

plot_pdp(max_velocity_model, "force_generator.push_off_distance")
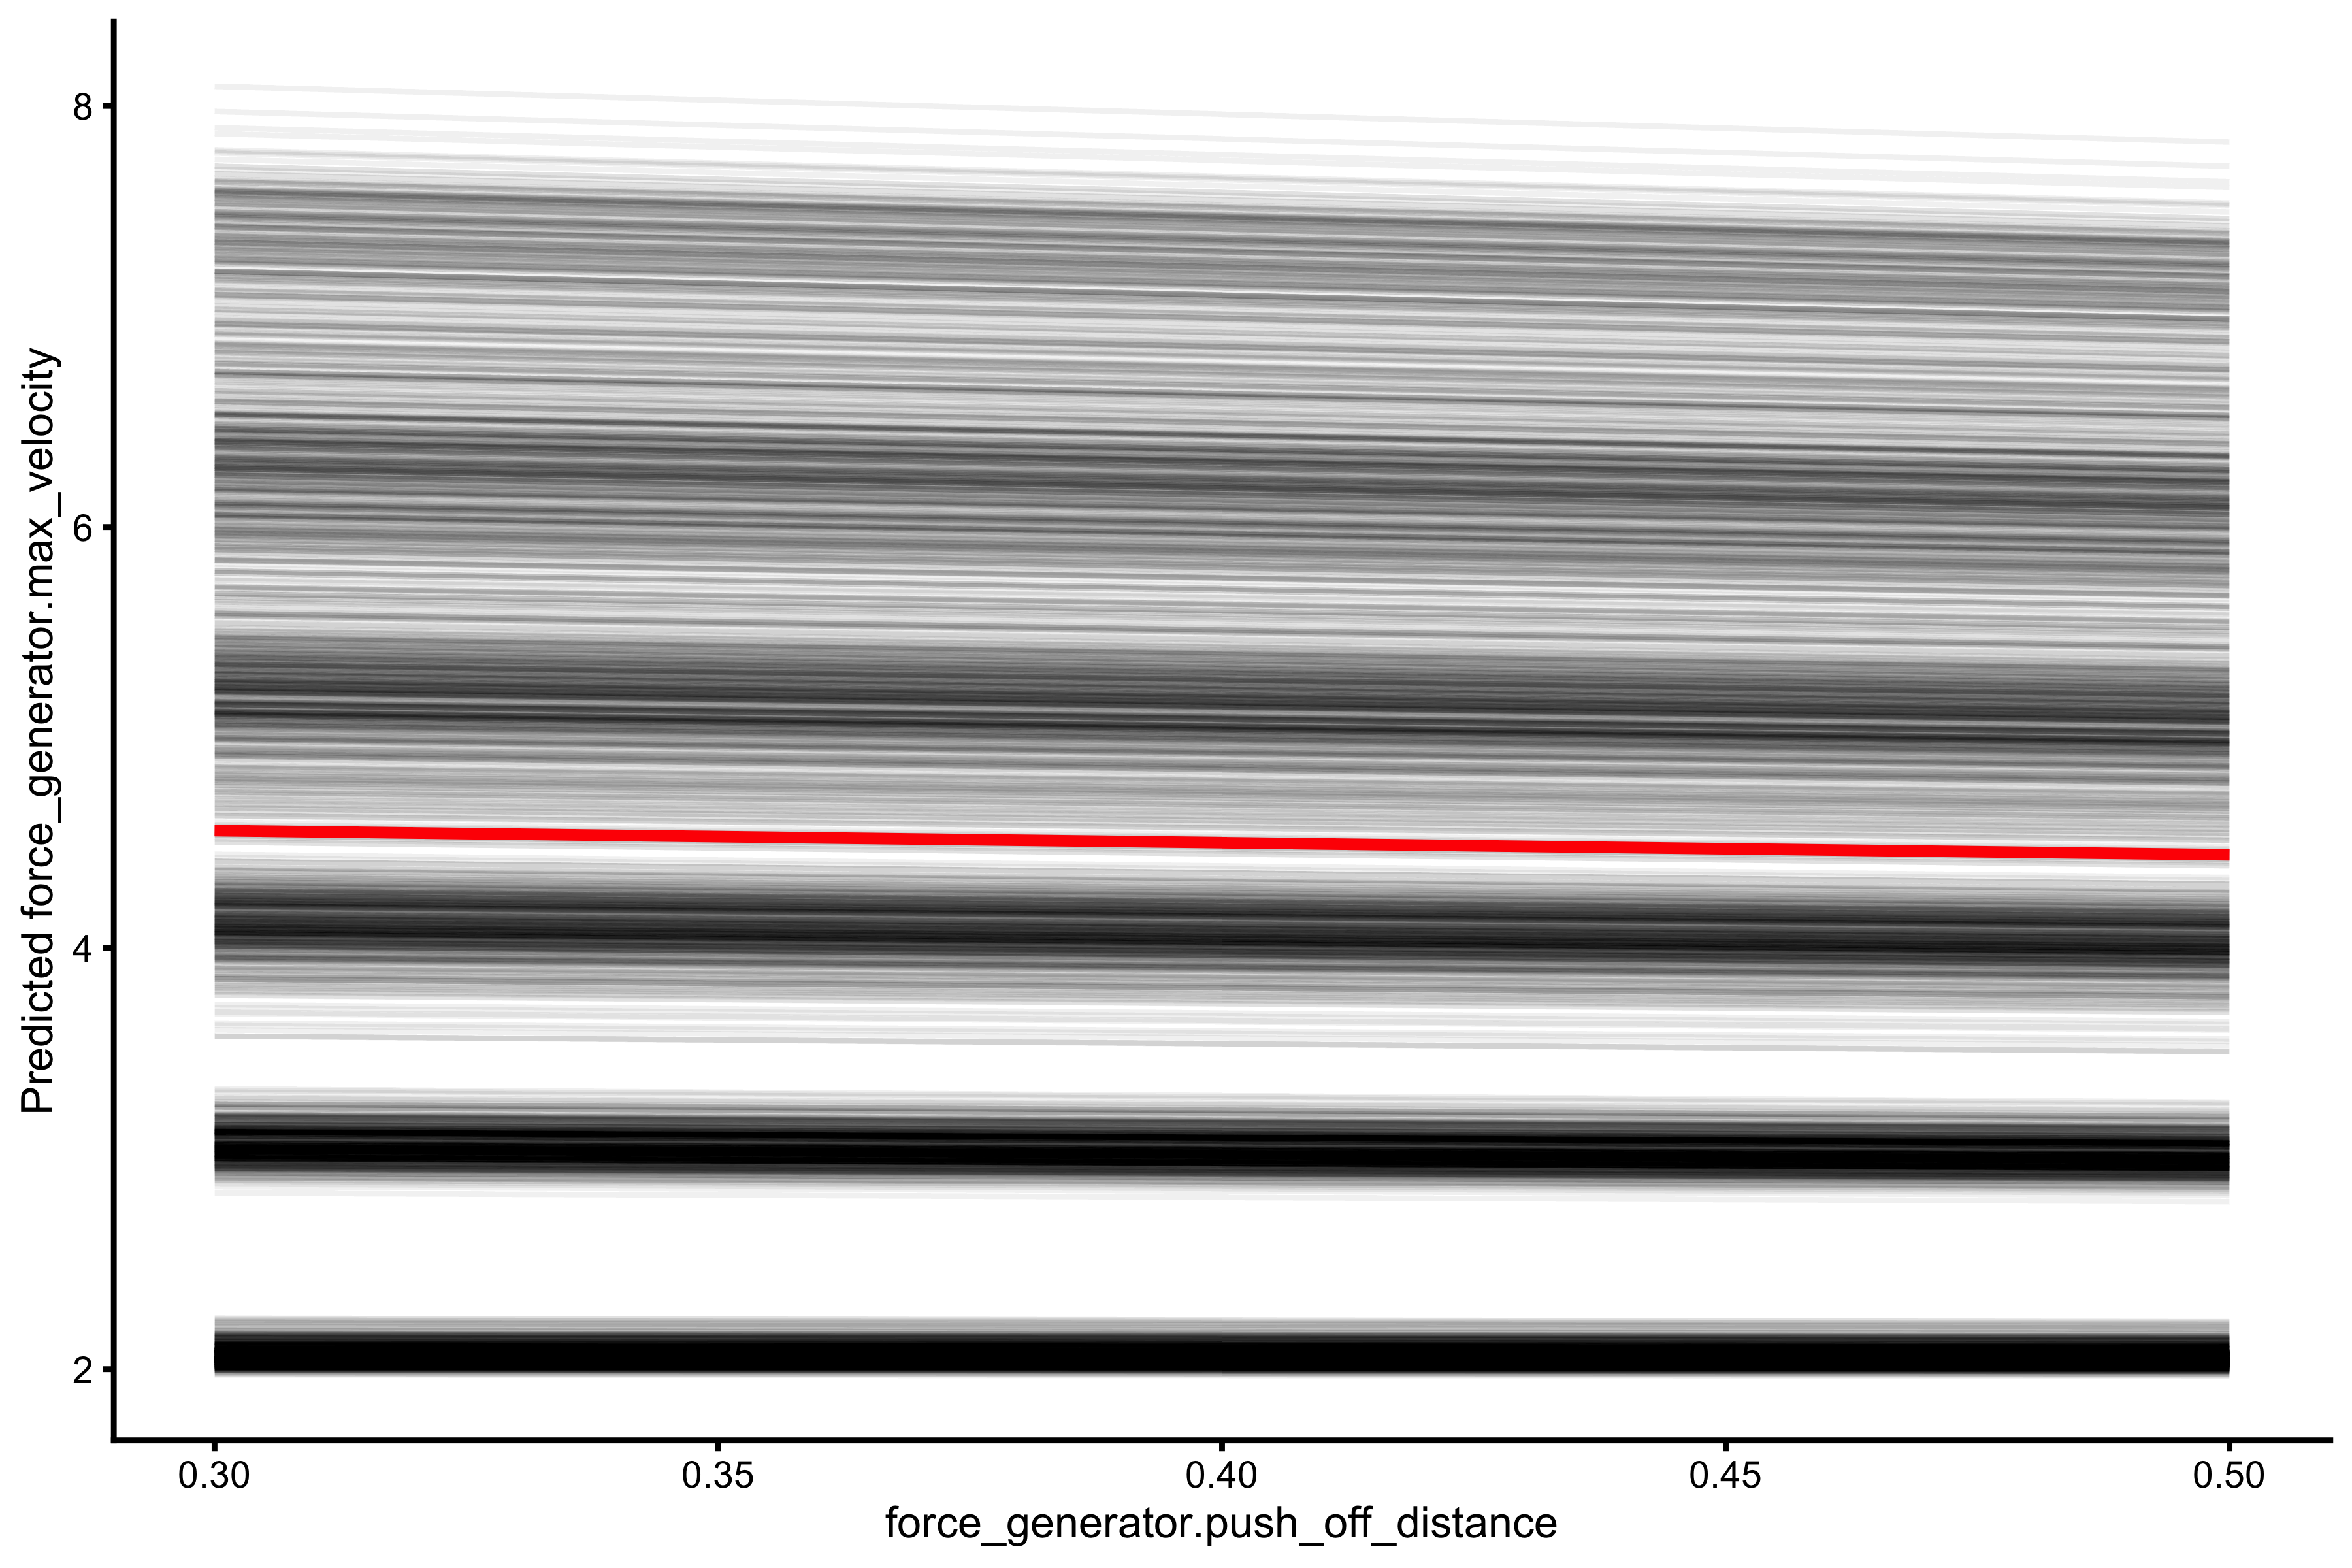
As opposed to max force, push-off distance is now more important than bodyweight in estimating max velocity. Although highly correlated, profile \(V_0\) is not a great predictor of true simulator max velocity (since residuals are outside of SESOI range).
The final exploration involve max power (\(P_{max}\)). Let’s check the simple scatter-plots first:
plot_relationship(
  "force_generator.Pmax",
  "profile_mean_FV.Pmax",
  identity = TRUE
)
#> $graph

#>
#> $R_squared
#> [1] 0.81796plot_relationship( "force_generator.Pmax", "profile_mean_power.Pmax", identity = TRUE ) #> $graph

#>
#> $R_squared
#> [1] 0.8188265plot_relationship( "force_generator.Pmax", "profile_peak_FV.Pmax", identity = TRUE ) #> $graph

#>
#> $R_squared
#> [1] 0.7464624plot_relationship( "force_generator.Pmax", "profile_peak_power.Pmax", identity = TRUE ) #> $graph

#>
#> $R_squared
#> [1] 0.02388299plot_relationship( "force_generator.Pmax", "samozino_practical_profile.Pmax", identity = TRUE ) #> $graph

#>
#> $R_squared
#> [1] 0.9795487
Again the Samozino practical profile demonstrates high correlation with true \(P_{max}\), but with some systematic bias. Let’s use multivariate linear model to predict \(P_{max}\) from samozino_practical_profile.Pmax, bodyweight and known push-off distance:
max_power_model <- regression_model(
  data = vjsim_data,
  target = "force_generator.Pmax",
  predictors = c(
    "force_generator.bodyweight",
    "force_generator.push_off_distance",
    "samozino_practical_profile.Pmax"
  ),
  interactions = TRUE, var_imp = "firm"
)

max_power_model$summary
#>
#> Call:
#> lm(formula = as.formula(paste(target, interactions_string)),
#>     data = model_df)
#>
#> Residuals:
#>     Min      1Q  Median      3Q     Max
#> -738.06 -108.83  -16.45   91.63 1621.34
#>
#> Coefficients:
#>                                                                     Estimate
#> (Intercept)                                                        7.875e-11
#> force_generator.bodyweight                                         2.497e+00
#> force_generator.push_off_distance                                 -8.892e-11
#> samozino_practical_profile.Pmax                                    1.737e+00
#> force_generator.bodyweight:force_generator.push_off_distance       6.772e+00
#> force_generator.bodyweight:samozino_practical_profile.Pmax         1.723e-16
#> force_generator.push_off_distance:samozino_practical_profile.Pmax -4.083e-01
#>                                                                   Std. Error
#> (Intercept)                                                        6.004e+01
#> force_generator.bodyweight                                         9.082e-01
#> force_generator.push_off_distance                                  1.370e+02
#> samozino_practical_profile.Pmax                                    1.874e-02
#> force_generator.bodyweight:force_generator.push_off_distance       2.097e+00
#> force_generator.bodyweight:samozino_practical_profile.Pmax         1.791e-04
#> force_generator.push_off_distance:samozino_practical_profile.Pmax  3.146e-02
#>                                                                   t value
#> (Intercept)                                                         0.000
#> force_generator.bodyweight                                          2.749
#> force_generator.push_off_distance                                   0.000
#> samozino_practical_profile.Pmax                                    92.711
#> force_generator.bodyweight:force_generator.push_off_distance        3.229
#> force_generator.bodyweight:samozino_practical_profile.Pmax          0.000
#> force_generator.push_off_distance:samozino_practical_profile.Pmax -12.978
#>                                                                   Pr(>|t|)
#> (Intercept)                                                        1.00000
#> force_generator.bodyweight                                         0.00599 **
#> force_generator.push_off_distance                                  1.00000
#> samozino_practical_profile.Pmax                                    < 2e-16 ***
#> force_generator.bodyweight:force_generator.push_off_distance       0.00125 **
#> force_generator.bodyweight:samozino_practical_profile.Pmax         1.00000
#> force_generator.push_off_distance:samozino_practical_profile.Pmax  < 2e-16 ***
#> ---
#> Signif. codes:  0 '***' 0.001 '**' 0.01 '*' 0.05 '.' 0.1 ' ' 1
#>
#> Residual standard error: 205.9 on 8633 degrees of freedom
#> Multiple R-squared:  0.9821, Adjusted R-squared:  0.9821
#> F-statistic: 7.9e+04 on 6 and 8633 DF,  p-value: < 2.2e-16
max_power_model$graph

max_power_model$var_imp

plot_pdp(max_power_model, "samozino_practical_profile.Pmax")

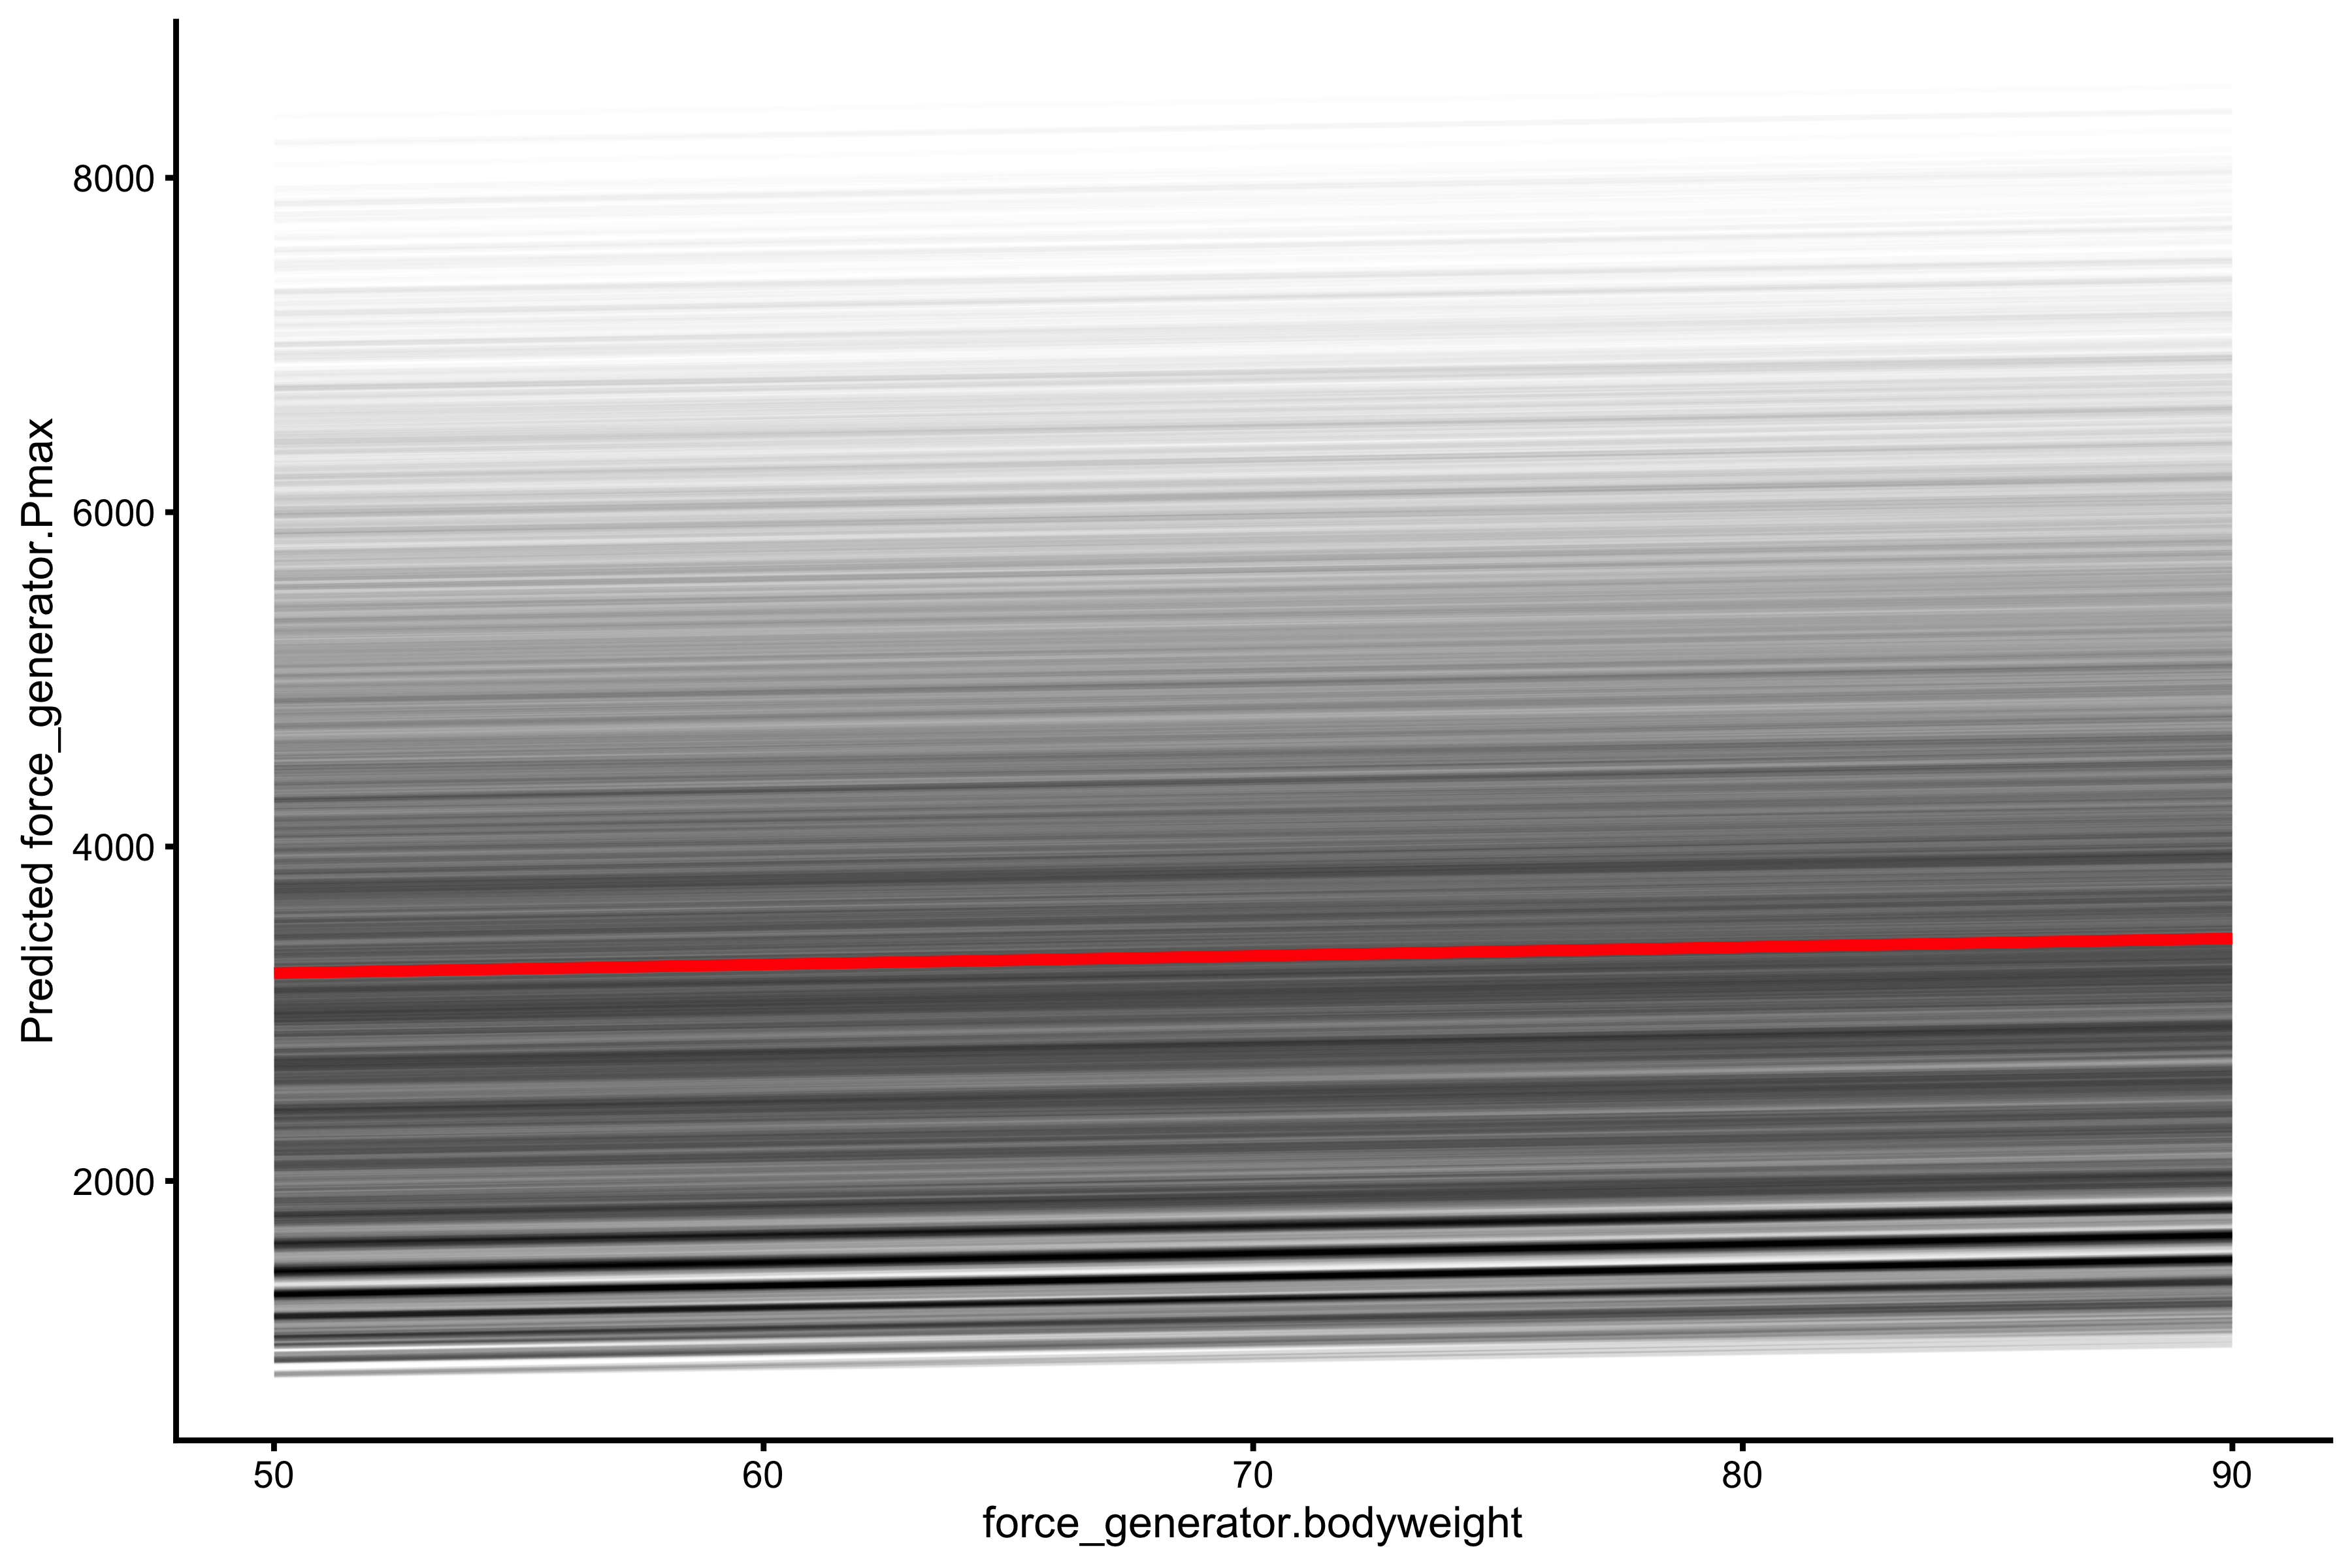
plot_pdp(max_power_model, "force_generator.bodyweight")
plot_pdp(max_power_model, "force_generator.push_off_distance")
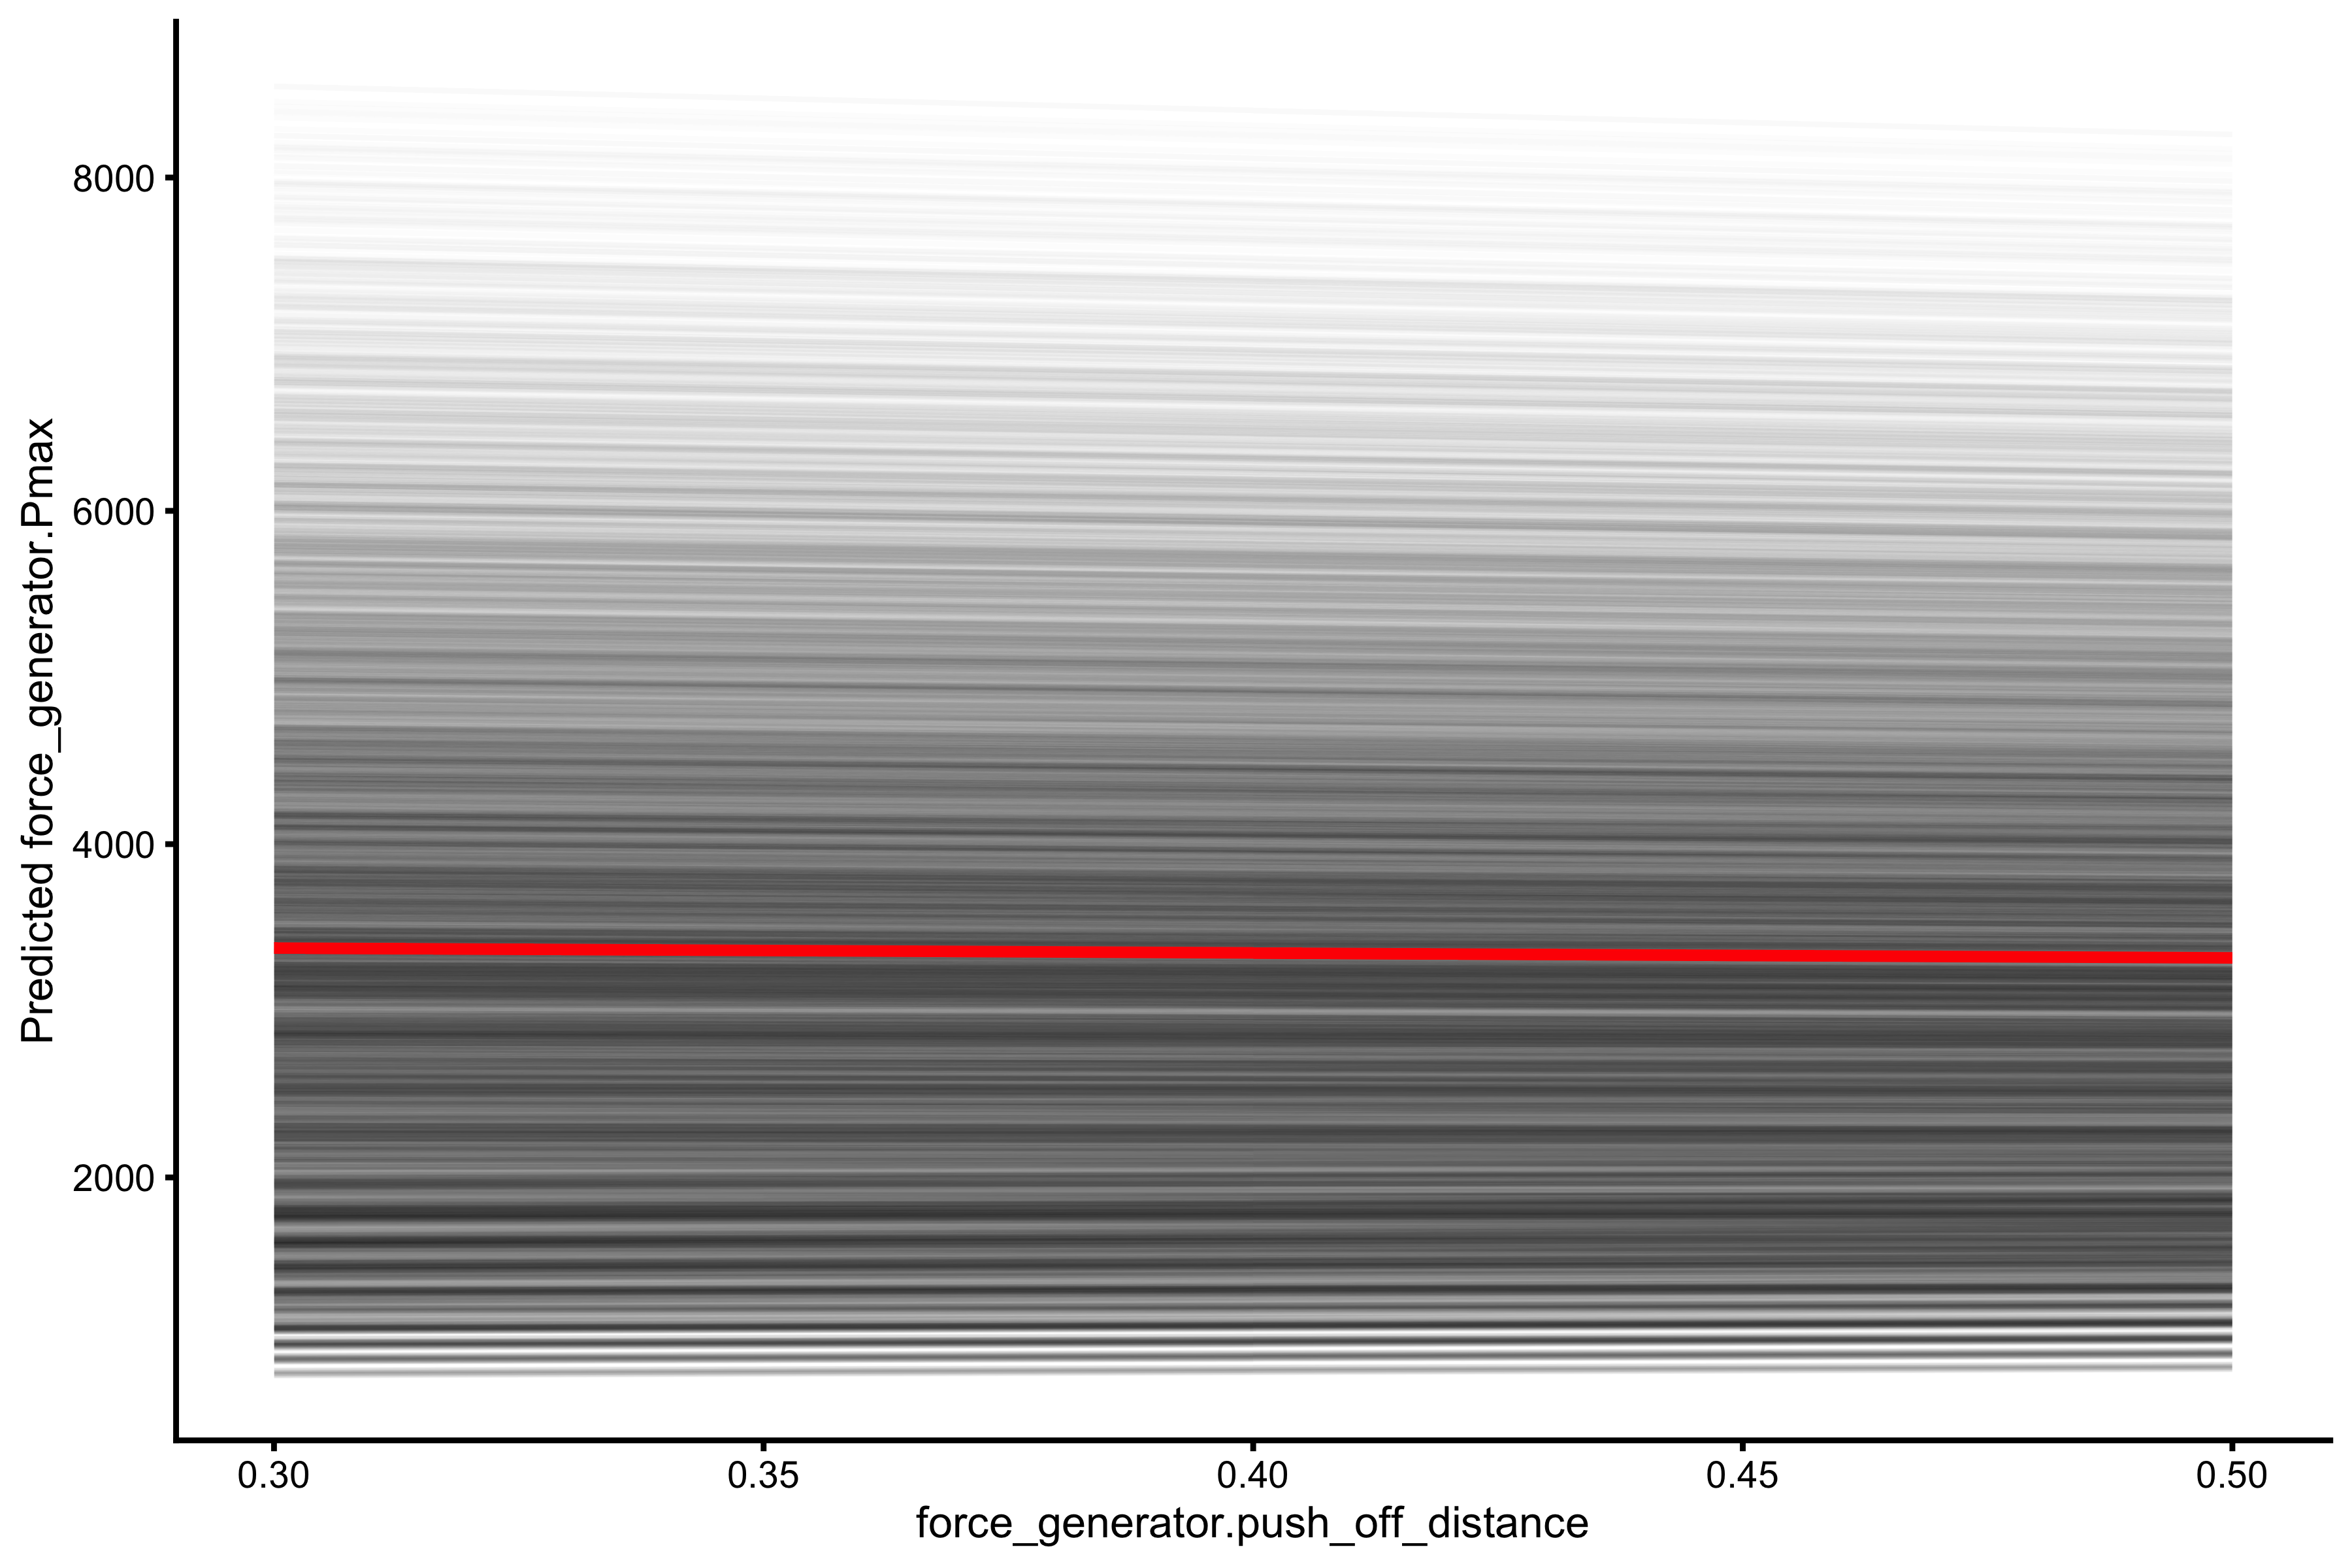
Overall, given the simulated data and vjsim model of the vertical jump, Samozino practical model profile constructs (i.e., \(F_0\), \(V_0\), and \(P_{max}\)) has great correlation to the true Force Generator values. My reluctance to accept these as ontological qualities is still ongoing, particularly since this simulation is related only to concentric squat jump. Real force generator qualities might manifest differently in different activities. In other words, \(P_{max}\) estimated in squat jump should highly correlated with \(P_{max}\) in broad jump, sprint and other activities. But this doesn’t negate their practical utility (I am leaning more toward pragmatist-realist stance).
Alignment between true bodyweight jump height and model predictions
Let’s see how different model jump height predictions align with true jump height.
samozino_theoretical_pred <- regression_model(
  data = vjsim_data,
  target = "bodyweight_jump.height",
  predictors = c(
    "samozino_theoretical_profile.height"
  ),
  interactions = TRUE, var_imp = "firm"
)

samozino_theoretical_pred$summary
#>
#> Call:
#> lm(formula = as.formula(paste(target, interactions_string)),
#>     data = model_df)
#>
#> Residuals:
#>      Min       1Q   Median       3Q      Max
#> -0.19956 -0.06419 -0.01594  0.05562  0.26333
#>
#> Coefficients:
#>                                      Estimate Std. Error t value Pr(>|t|)
#> (Intercept)                         -0.024366   0.002403  -10.14   <2e-16 ***
#> samozino_theoretical_profile.height  1.121217   0.006390  175.46   <2e-16 ***
#> ---
#> Signif. codes:  0 '***' 0.001 '**' 0.01 '*' 0.05 '.' 0.1 ' ' 1
#>
#> Residual standard error: 0.08584 on 8638 degrees of freedom
#> Multiple R-squared:  0.7809, Adjusted R-squared:  0.7809
#> F-statistic: 3.079e+04 on 1 and 8638 DF,  p-value: < 2.2e-16
samozino_theoretical_pred$graph

Theoretical Samozino model (the one that uses true mean velocity, rather than take-off velocity) is very bad at predicting jump height. Let’s see how the practical model performs:
samozino_practical_pred <- regression_model(
  data = vjsim_data,
  target = "bodyweight_jump.height",
  predictors = c(
    "samozino_practical_profile.height"
  ),
  interactions = TRUE, var_imp = "firm"
)

samozino_practical_pred$summary
#>
#> Call:
#> lm(formula = as.formula(paste(target, interactions_string)),
#>     data = model_df)
#>
#> Residuals:
#>        Min         1Q     Median         3Q        Max
#> -3.077e-03 -4.206e-04  5.937e-05  4.930e-04  2.648e-03
#>
#> Coefficients:
#>                                     Estimate Std. Error  t value Pr(>|t|)
#> (Intercept)                       -5.775e-04  1.953e-05   -29.57   <2e-16 ***
#> samozino_practical_profile.height  9.957e-01  4.757e-05 20932.38   <2e-16 ***
#> ---
#> Signif. codes:  0 '***' 0.001 '**' 0.01 '*' 0.05 '.' 0.1 ' ' 1
#>
#> Residual standard error: 0.0008143 on 8638 degrees of freedom
#> Multiple R-squared:      1,  Adjusted R-squared:      1
#> F-statistic: 4.382e+08 on 1 and 8638 DF,  p-value: < 2.2e-16
samozino_practical_pred$graph

And this is, ladies and gents, example of perfect prediction. Let’s see how the “simple model” performs:
simple_pred <- regression_model(
  data = vjsim_data,
  target = "bodyweight_jump.height",
  predictors = c(
    "simple_profile.height"
  ),
  interactions = TRUE, var_imp = "firm"
)

simple_pred$summary
#>
#> Call:
#> lm(formula = as.formula(paste(target, interactions_string)),
#>     data = model_df)
#>
#> Residuals:
#>        Min         1Q     Median         3Q        Max
#> -0.0051288 -0.0010871  0.0000921  0.0008277  0.0048459
#>
#> Coefficients:
#>                         Estimate Std. Error t value Pr(>|t|)
#> (Intercept)           -2.866e-03  4.143e-05  -69.17   <2e-16 ***
#> simple_profile.height  1.022e+00  1.030e-04 9919.16   <2e-16 ***
#> ---
#> Signif. codes:  0 '***' 0.001 '**' 0.01 '*' 0.05 '.' 0.1 ' ' 1
#>
#> Residual standard error: 0.001718 on 8638 degrees of freedom
#> Multiple R-squared:  0.9999, Adjusted R-squared:  0.9999
#> F-statistic: 9.839e+07 on 1 and 8638 DF,  p-value: < 2.2e-16
simple_pred$graph

This also represents perfect prediction.
What predicts the jump height?
Let’s explore what variables predict vertical jump height. I will split this analysis into two parts: (1) exploration of the Force Generator characteristics, and (2) exploration using practical Samozino profile.
Force Generator characteristics
I will use the above function to plot relationship of Force Generator characteristics with vertical jump height, as well as to model using linear regression model at the end of this section.
plot_relationship(
  "force_generator.max_force",
  "bodyweight_jump.height"
)
#> $graph

#>
#> $R_squared
#> [1] 0.01901522
Max force seems to have very low relationship with jump height. Let’s check relative max force (divided by bodyweight):
plot_relationship(
  "force_generator.F0_rel",
  "bodyweight_jump.height"
)
#> $graph

#>
#> $R_squared
#> [1] 0.06465174
Let’s check max velocity:
plot_relationship(
  "force_generator.max_velocity",
  "bodyweight_jump.height"
)
#> $graph

#>
#> $R_squared
#> [1] 0.816508
Much better association between the two. Let’s check the max power:
plot_relationship(
  "force_generator.Pmax",
  "bodyweight_jump.height"
)
#> $graph

#>
#> $R_squared
#> [1] 0.6942989
Interestingly, although high association, it is lower than max velocity. Let’s check relative max power:
plot_relationship(
  "force_generator.Pmax_rel",
  "bodyweight_jump.height"
)
#> $graph

#>
#> $R_squared
#> [1] 0.8956185
So far, relative max power has the highest association with jump height.
Let’s perform some modeling using know Force Generator parameters:
fgen_height_model <- regression_model(
  data = vjsim_data,
  target = "bodyweight_jump.height",
  predictors = c(
    "force_generator.bodyweight",
    "force_generator.push_off_distance",
    "force_generator.max_force",
    "force_generator.max_velocity",
    "force_generator.time_to_max_activation",
    "force_generator.decline_rate",
    "force_generator.peak_location"
  ),
  interactions = TRUE, var_imp = "firm"
)

fgen_height_model$summary
#>
#> Call:
#> lm(formula = as.formula(paste(target, interactions_string)),
#>     data = model_df)
#>
#> Residuals:
#>       Min        1Q    Median        3Q       Max
#> -0.086947 -0.018600  0.002937  0.017716  0.059034
#>
#> Coefficients:
#>                                                                            Estimate
#> (Intercept)                                                               5.907e-04
#> force_generator.bodyweight                                                5.330e-03
#> force_generator.push_off_distance                                        -4.890e-01
#> force_generator.max_force                                                -3.977e-05
#> force_generator.max_velocity                                              2.690e-02
#> force_generator.time_to_max_activation                                   -8.122e-02
#> force_generator.decline_rate                                              4.262e-02
#> force_generator.peak_location                                             5.959e-01
#> force_generator.bodyweight:force_generator.push_off_distance             -6.325e-03
#> force_generator.bodyweight:force_generator.max_force                     -6.118e-07
#> force_generator.bodyweight:force_generator.max_velocity                  -1.497e-03
#> force_generator.bodyweight:force_generator.time_to_max_activation         2.746e-03
#> force_generator.bodyweight:force_generator.decline_rate                  -1.009e-04
#> force_generator.bodyweight:force_generator.peak_location                 -2.355e-03
#> force_generator.push_off_distance:force_generator.max_force               1.488e-04
#> force_generator.push_off_distance:force_generator.max_velocity            2.172e-01
#> force_generator.push_off_distance:force_generator.time_to_max_activation  2.919e-01
#> force_generator.push_off_distance:force_generator.decline_rate           -1.241e-01
#> force_generator.push_off_distance:force_generator.peak_location          -8.296e-01
#> force_generator.max_force:force_generator.max_velocity                    3.522e-05
#> force_generator.max_force:force_generator.time_to_max_activation         -6.460e-05
#> force_generator.max_force:force_generator.decline_rate                    2.373e-06
#> force_generator.max_force:force_generator.peak_location                   5.540e-05
#> force_generator.max_velocity:force_generator.time_to_max_activation      -2.959e-02
#> force_generator.max_velocity:force_generator.decline_rate                -6.591e-03
#> force_generator.max_velocity:force_generator.peak_location                6.835e-02
#> force_generator.time_to_max_activation:force_generator.decline_rate       4.451e-02
#> force_generator.time_to_max_activation:force_generator.peak_location      1.680e-01
#> force_generator.decline_rate:force_generator.peak_location               -1.522e-01
#>                                                                          Std. Error
#> (Intercept)                                                               1.386e-02
#> force_generator.bodyweight                                                2.524e-04
#> force_generator.push_off_distance                                         2.313e-02
#> force_generator.max_force                                                 5.169e-06
#> force_generator.max_velocity                                              1.260e-03
#> force_generator.time_to_max_activation                                    1.950e-02
#> force_generator.decline_rate                                              8.563e-03
#> force_generator.peak_location                                             1.061e-01
#> force_generator.bodyweight:force_generator.push_off_distance              3.912e-04
#> force_generator.bodyweight:force_generator.max_force                      2.820e-08
#> force_generator.bodyweight:force_generator.max_velocity                   1.870e-05
#> force_generator.bodyweight:force_generator.time_to_max_activation         2.857e-04
#> force_generator.bodyweight:force_generator.decline_rate                   1.304e-04
#> force_generator.bodyweight:force_generator.peak_location                  1.597e-03
#> force_generator.push_off_distance:force_generator.max_force               7.667e-06
#> force_generator.push_off_distance:force_generator.max_velocity            1.792e-03
#> force_generator.push_off_distance:force_generator.time_to_max_activation  2.738e-02
#> force_generator.push_off_distance:force_generator.decline_rate            1.250e-02
#> force_generator.push_off_distance:force_generator.peak_location           1.530e-01
#> force_generator.max_force:force_generator.max_velocity                    3.666e-07
#> force_generator.max_force:force_generator.time_to_max_activation          5.599e-06
#> force_generator.max_force:force_generator.decline_rate                    2.556e-06
#> force_generator.max_force:force_generator.peak_location                   3.130e-05
#> force_generator.max_velocity:force_generator.time_to_max_activation       1.309e-03
#> force_generator.max_velocity:force_generator.decline_rate                 5.974e-04
#> force_generator.max_velocity:force_generator.peak_location                7.317e-03
#> force_generator.time_to_max_activation:force_generator.decline_rate       9.125e-03
#> force_generator.time_to_max_activation:force_generator.peak_location      1.118e-01
#> force_generator.decline_rate:force_generator.peak_location                5.101e-02
#>                                                                          t value
#> (Intercept)                                                                0.043
#> force_generator.bodyweight                                                21.116
#> force_generator.push_off_distance                                        -21.140
#> force_generator.max_force                                                 -7.694
#> force_generator.max_velocity                                              21.345
#> force_generator.time_to_max_activation                                    -4.165
#> force_generator.decline_rate                                               4.978
#> force_generator.peak_location                                              5.616
#> force_generator.bodyweight:force_generator.push_off_distance             -16.170
#> force_generator.bodyweight:force_generator.max_force                     -21.693
#> force_generator.bodyweight:force_generator.max_velocity                  -80.032
#> force_generator.bodyweight:force_generator.time_to_max_activation          9.611
#> force_generator.bodyweight:force_generator.decline_rate                   -0.774
#> force_generator.bodyweight:force_generator.peak_location                  -1.475
#> force_generator.push_off_distance:force_generator.max_force               19.412
#> force_generator.push_off_distance:force_generator.max_velocity           121.210
#> force_generator.push_off_distance:force_generator.time_to_max_activation  10.661
#> force_generator.push_off_distance:force_generator.decline_rate            -9.935
#> force_generator.push_off_distance:force_generator.peak_location           -5.421
#> force_generator.max_force:force_generator.max_velocity                    96.077
#> force_generator.max_force:force_generator.time_to_max_activation         -11.539
#> force_generator.max_force:force_generator.decline_rate                     0.929
#> force_generator.max_force:force_generator.peak_location                    1.770
#> force_generator.max_velocity:force_generator.time_to_max_activation      -22.607
#> force_generator.max_velocity:force_generator.decline_rate                -11.033
#> force_generator.max_velocity:force_generator.peak_location                 9.341
#> force_generator.time_to_max_activation:force_generator.decline_rate        4.877
#> force_generator.time_to_max_activation:force_generator.peak_location       1.504
#> force_generator.decline_rate:force_generator.peak_location                -2.984
#>                                                                          Pr(>|t|)
#> (Intercept)                                                               0.96601
#> force_generator.bodyweight                                                < 2e-16
#> force_generator.push_off_distance                                         < 2e-16
#> force_generator.max_force                                                1.58e-14
#> force_generator.max_velocity                                              < 2e-16
#> force_generator.time_to_max_activation                                   3.14e-05
#> force_generator.decline_rate                                             6.56e-07
#> force_generator.peak_location                                            2.02e-08
#> force_generator.bodyweight:force_generator.push_off_distance              < 2e-16
#> force_generator.bodyweight:force_generator.max_force                      < 2e-16
#> force_generator.bodyweight:force_generator.max_velocity                   < 2e-16
#> force_generator.bodyweight:force_generator.time_to_max_activation         < 2e-16
#> force_generator.bodyweight:force_generator.decline_rate                   0.43919
#> force_generator.bodyweight:force_generator.peak_location                  0.14038
#> force_generator.push_off_distance:force_generator.max_force               < 2e-16
#> force_generator.push_off_distance:force_generator.max_velocity            < 2e-16
#> force_generator.push_off_distance:force_generator.time_to_max_activation  < 2e-16
#> force_generator.push_off_distance:force_generator.decline_rate            < 2e-16
#> force_generator.push_off_distance:force_generator.peak_location          6.08e-08
#> force_generator.max_force:force_generator.max_velocity                    < 2e-16
#> force_generator.max_force:force_generator.time_to_max_activation          < 2e-16
#> force_generator.max_force:force_generator.decline_rate                    0.35308
#> force_generator.max_force:force_generator.peak_location                   0.07674
#> force_generator.max_velocity:force_generator.time_to_max_activation       < 2e-16
#> force_generator.max_velocity:force_generator.decline_rate                 < 2e-16
#> force_generator.max_velocity:force_generator.peak_location                < 2e-16
#> force_generator.time_to_max_activation:force_generator.decline_rate      1.09e-06
#> force_generator.time_to_max_activation:force_generator.peak_location      0.13272
#> force_generator.decline_rate:force_generator.peak_location                0.00285
#>
#> (Intercept)
#> force_generator.bodyweight                                               ***
#> force_generator.push_off_distance                                        ***
#> force_generator.max_force                                                ***
#> force_generator.max_velocity                                             ***
#> force_generator.time_to_max_activation                                   ***
#> force_generator.decline_rate                                             ***
#> force_generator.peak_location                                            ***
#> force_generator.bodyweight:force_generator.push_off_distance             ***
#> force_generator.bodyweight:force_generator.max_force                     ***
#> force_generator.bodyweight:force_generator.max_velocity                  ***
#> force_generator.bodyweight:force_generator.time_to_max_activation        ***
#> force_generator.bodyweight:force_generator.decline_rate
#> force_generator.bodyweight:force_generator.peak_location
#> force_generator.push_off_distance:force_generator.max_force              ***
#> force_generator.push_off_distance:force_generator.max_velocity           ***
#> force_generator.push_off_distance:force_generator.time_to_max_activation ***
#> force_generator.push_off_distance:force_generator.decline_rate           ***
#> force_generator.push_off_distance:force_generator.peak_location          ***
#> force_generator.max_force:force_generator.max_velocity                   ***
#> force_generator.max_force:force_generator.time_to_max_activation         ***
#> force_generator.max_force:force_generator.decline_rate
#> force_generator.max_force:force_generator.peak_location                  .
#> force_generator.max_velocity:force_generator.time_to_max_activation      ***
#> force_generator.max_velocity:force_generator.decline_rate                ***
#> force_generator.max_velocity:force_generator.peak_location               ***
#> force_generator.time_to_max_activation:force_generator.decline_rate      ***
#> force_generator.time_to_max_activation:force_generator.peak_location
#> force_generator.decline_rate:force_generator.peak_location               **
#> ---
#> Signif. codes:  0 '***' 0.001 '**' 0.01 '*' 0.05 '.' 0.1 ' ' 1
#>
#> Residual standard error: 0.02323 on 8611 degrees of freedom
#> Multiple R-squared:  0.984,  Adjusted R-squared:  0.984
#> F-statistic: 1.892e+04 on 28 and 8611 DF,  p-value: < 2.2e-16
fgen_height_model$graph

fgen_height_model$var_imp

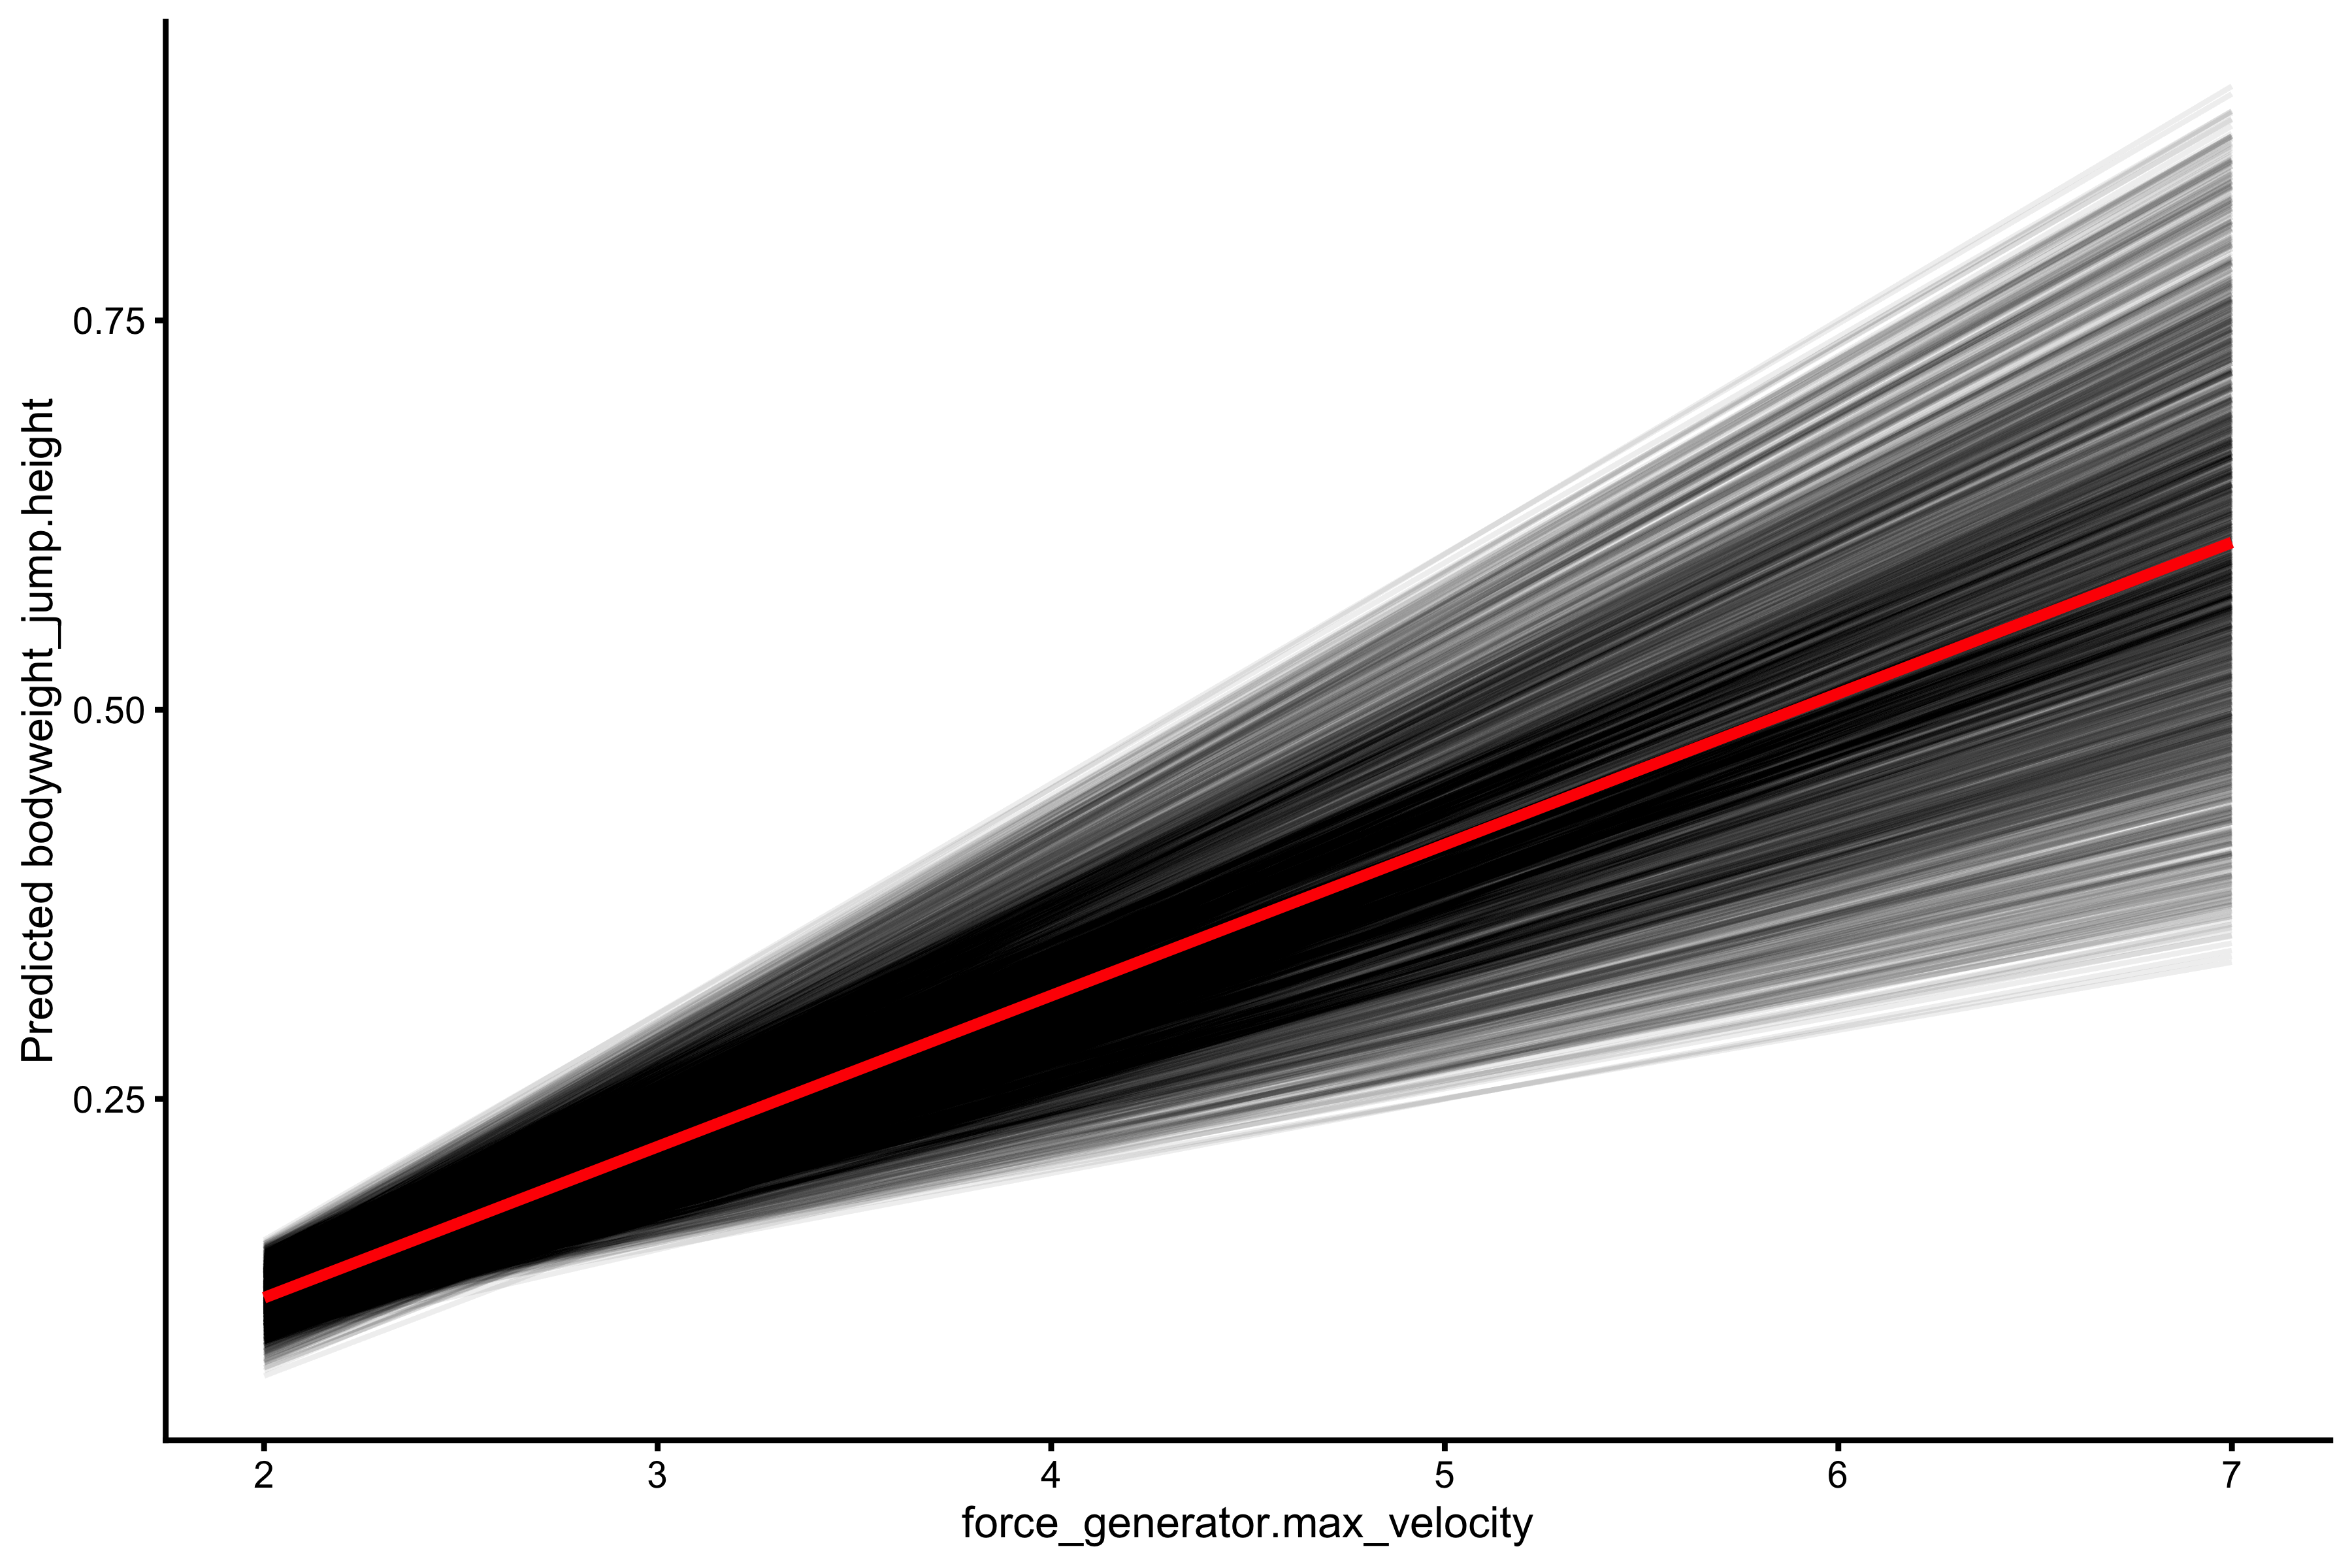
plot_pdp(fgen_height_model, "force_generator.max_velocity")
plot_pdp(fgen_height_model, "force_generator.max_force")
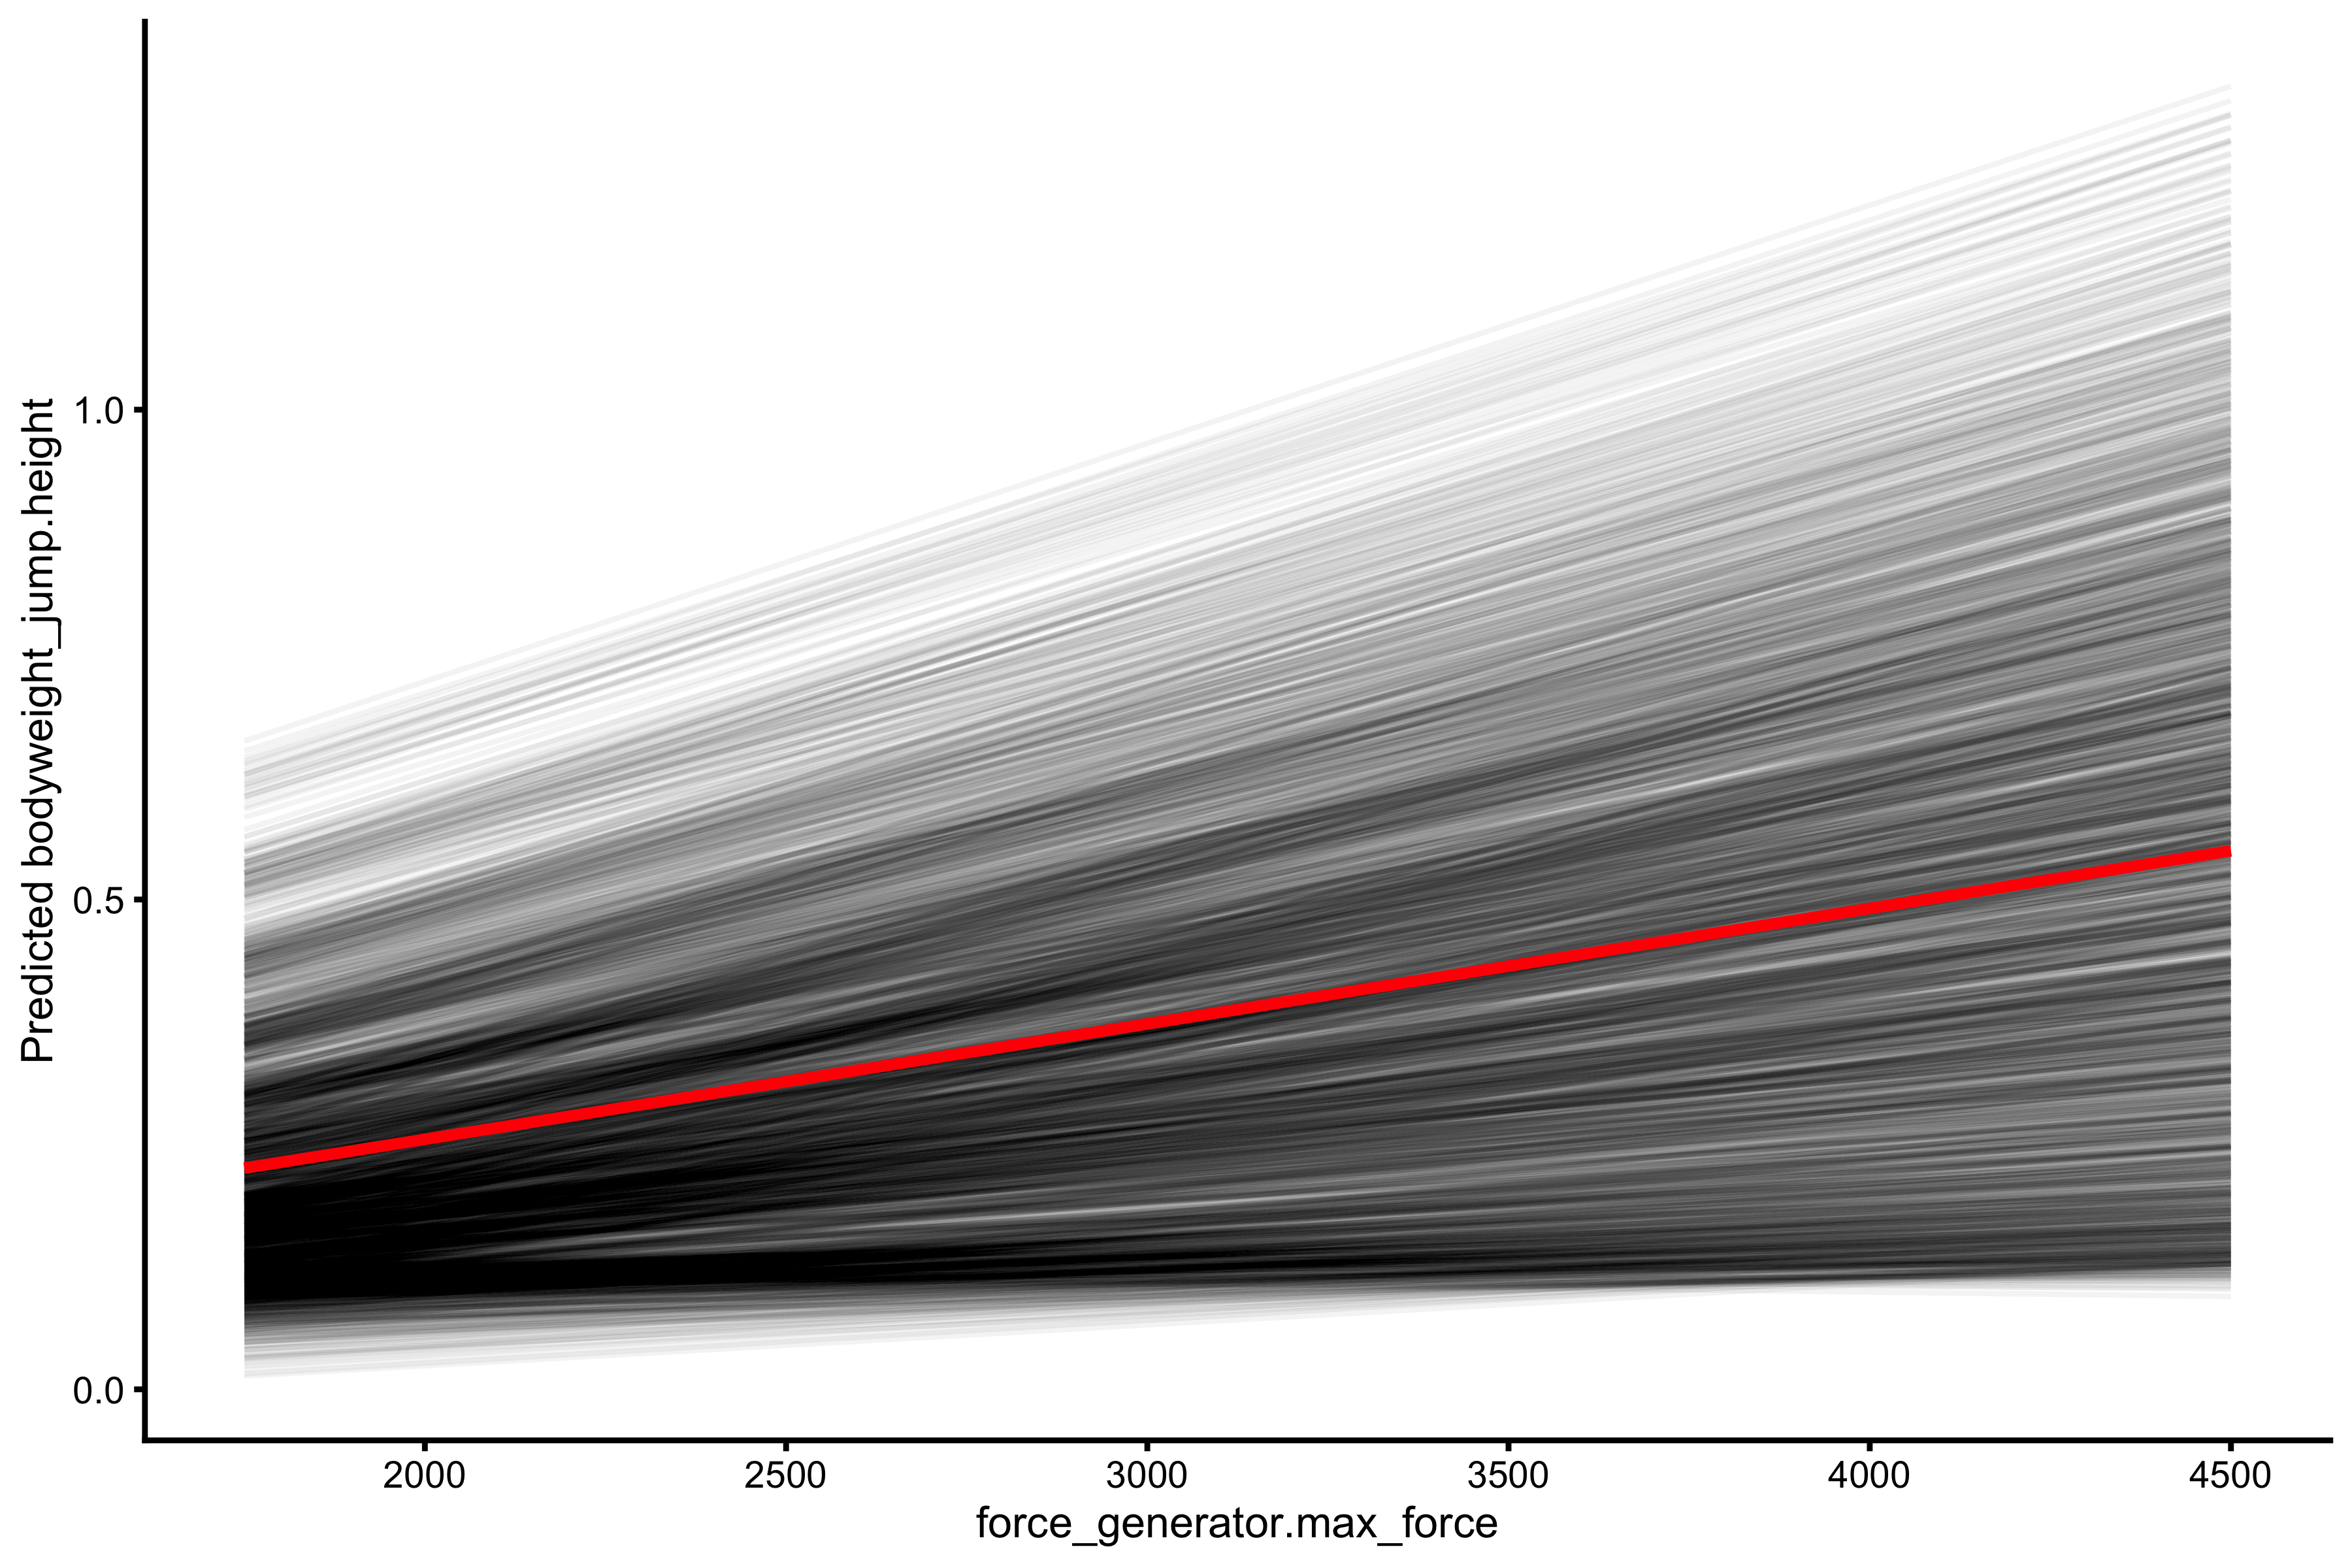
plot_pdp(fgen_height_model, "force_generator.bodyweight")
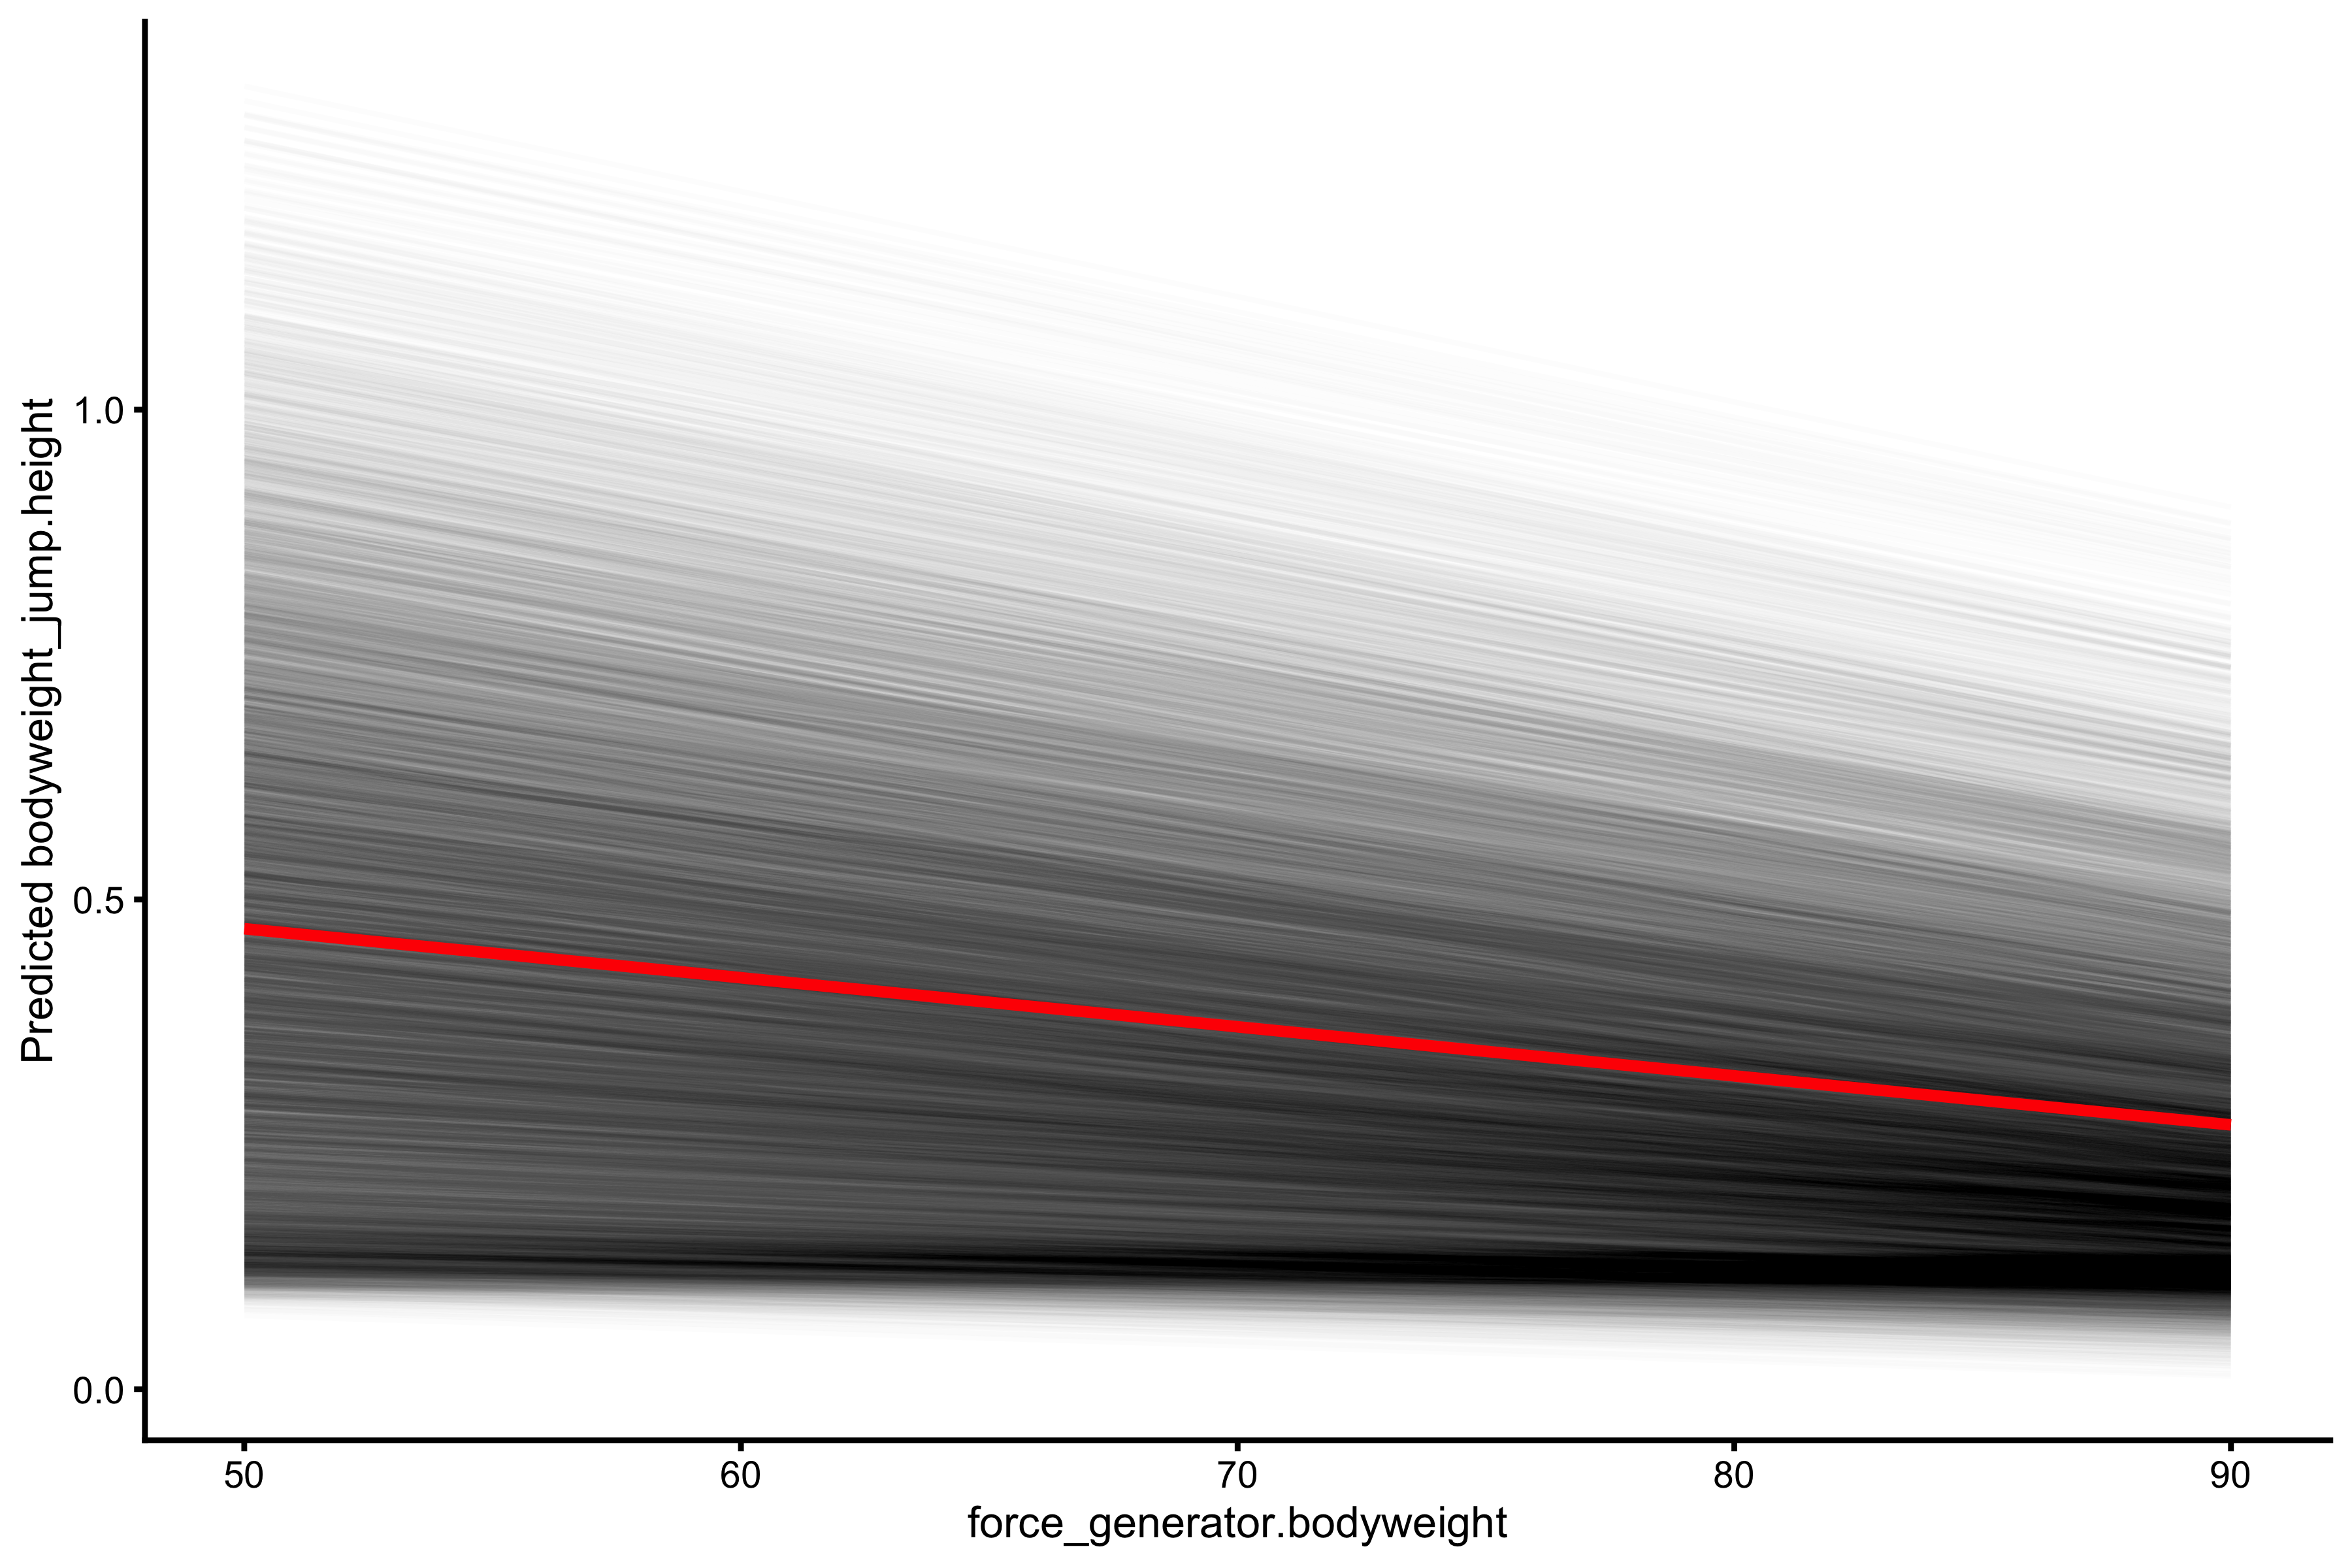
The jump height prediction (using multivariate linear regression with interaction) from the known Force Generator characteristics is almost perfect, with very high \(R^2\).
Practical Samozino profile
Let’s repeat this analysis using Samozino profile:
plot_relationship(
  "samozino_practical_profile.F0",
  "bodyweight_jump.height"
)
#> $graph

#>
#> $R_squared
#> [1] 0.05788338
Not great as expected. Let’s use relative \(F_0\):
plot_relationship(
  "samozino_practical_profile.F0_rel",
  "bodyweight_jump.height"
)
#> $graph

#>
#> $R_squared
#> [1] 0.1467072
Let’s check \(V_0\):
plot_relationship(
  "samozino_practical_profile.V0",
  "bodyweight_jump.height"
)
#> $graph

#>
#> $R_squared
#> [1] 0.7916385
Again, much higher association than force. Let’s check \(P_{max}\):
plot_relationship(
  "samozino_practical_profile.Pmax",
  "bodyweight_jump.height"
)
#> $graph

#>
#> $R_squared
#> [1] 0.7449721
And finally, relative \(P_{max}\):
plot_relationship(
  "samozino_practical_profile.Pmax_rel",
  "bodyweight_jump.height"
)
#> $graph

#>
#> $R_squared
#> [1] 0.9258284
Relative \(P_{max}\) shows very high association with jump height (this could be the circular causality explained in the previous vignette: we use performance metrics to device underlying determinants of performance). Let’s perform multivariate prediction using linear regression with interactions:
samozino_height_model <- regression_model(
  data = vjsim_data,
  target = "bodyweight_jump.height",
  predictors = c(
    "force_generator.bodyweight",
    "force_generator.push_off_distance",
    "samozino_practical_profile.F0",
    "samozino_practical_profile.V0"
  ),
  interactions = TRUE, var_imp = "firm"
)

samozino_height_model$summary
#>
#> Call:
#> lm(formula = as.formula(paste(target, interactions_string)),
#>     data = model_df)
#>
#> Residuals:
#>       Min        1Q    Median        3Q       Max
#> -0.093858 -0.014627  0.002152  0.015270  0.052084
#>
#> Coefficients:
#>                                                                   Estimate
#> (Intercept)                                                     -7.622e-02
#> force_generator.bodyweight                                       4.964e-03
#> force_generator.push_off_distance                               -2.587e-01
#> samozino_practical_profile.F0                                   -5.118e-06
#> samozino_practical_profile.V0                                    3.203e-02
#> force_generator.bodyweight:force_generator.push_off_distance    -4.673e-03
#> force_generator.bodyweight:samozino_practical_profile.F0        -8.937e-07
#> force_generator.bodyweight:samozino_practical_profile.V0        -2.276e-03
#> force_generator.push_off_distance:samozino_practical_profile.F0  1.212e-04
#> force_generator.push_off_distance:samozino_practical_profile.V0  2.660e-01
#> samozino_practical_profile.F0:samozino_practical_profile.V0      5.864e-05
#>                                                                 Std. Error
#> (Intercept)                                                      8.269e-03
#> force_generator.bodyweight                                       1.503e-04
#> force_generator.push_off_distance                                1.556e-02
#> samozino_practical_profile.F0                                    3.256e-06
#> samozino_practical_profile.V0                                    1.410e-03
#> force_generator.bodyweight:force_generator.push_off_distance     3.066e-04
#> force_generator.bodyweight:samozino_practical_profile.F0         2.517e-08
#> force_generator.bodyweight:samozino_practical_profile.V0         2.210e-05
#> force_generator.push_off_distance:samozino_practical_profile.F0  5.962e-06
#> force_generator.push_off_distance:samozino_practical_profile.V0  2.447e-03
#> samozino_practical_profile.F0:samozino_practical_profile.V0      4.451e-07
#>                                                                  t value
#> (Intercept)                                                       -9.217
#> force_generator.bodyweight                                        33.026
#> force_generator.push_off_distance                                -16.631
#> samozino_practical_profile.F0                                     -1.572
#> samozino_practical_profile.V0                                     22.711
#> force_generator.bodyweight:force_generator.push_off_distance     -15.241
#> force_generator.bodyweight:samozino_practical_profile.F0         -35.500
#> force_generator.bodyweight:samozino_practical_profile.V0        -102.983
#> force_generator.push_off_distance:samozino_practical_profile.F0   20.333
#> force_generator.push_off_distance:samozino_practical_profile.V0  108.693
#> samozino_practical_profile.F0:samozino_practical_profile.V0      131.740
#>                                                                 Pr(>|t|)
#> (Intercept)                                                       <2e-16 ***
#> force_generator.bodyweight                                        <2e-16 ***
#> force_generator.push_off_distance                                 <2e-16 ***
#> samozino_practical_profile.F0                                      0.116
#> samozino_practical_profile.V0                                     <2e-16 ***
#> force_generator.bodyweight:force_generator.push_off_distance      <2e-16 ***
#> force_generator.bodyweight:samozino_practical_profile.F0          <2e-16 ***
#> force_generator.bodyweight:samozino_practical_profile.V0          <2e-16 ***
#> force_generator.push_off_distance:samozino_practical_profile.F0   <2e-16 ***
#> force_generator.push_off_distance:samozino_practical_profile.V0   <2e-16 ***
#> samozino_practical_profile.F0:samozino_practical_profile.V0       <2e-16 ***
#> ---
#> Signif. codes:  0 '***' 0.001 '**' 0.01 '*' 0.05 '.' 0.1 ' ' 1
#>
#> Residual standard error: 0.02112 on 8629 degrees of freedom
#> Multiple R-squared:  0.9868, Adjusted R-squared:  0.9867
#> F-statistic: 6.426e+04 on 10 and 8629 DF,  p-value: < 2.2e-16
samozino_height_model$graph

samozino_height_model$var_imp

plot_pdp(samozino_height_model, "samozino_practical_profile.F0")
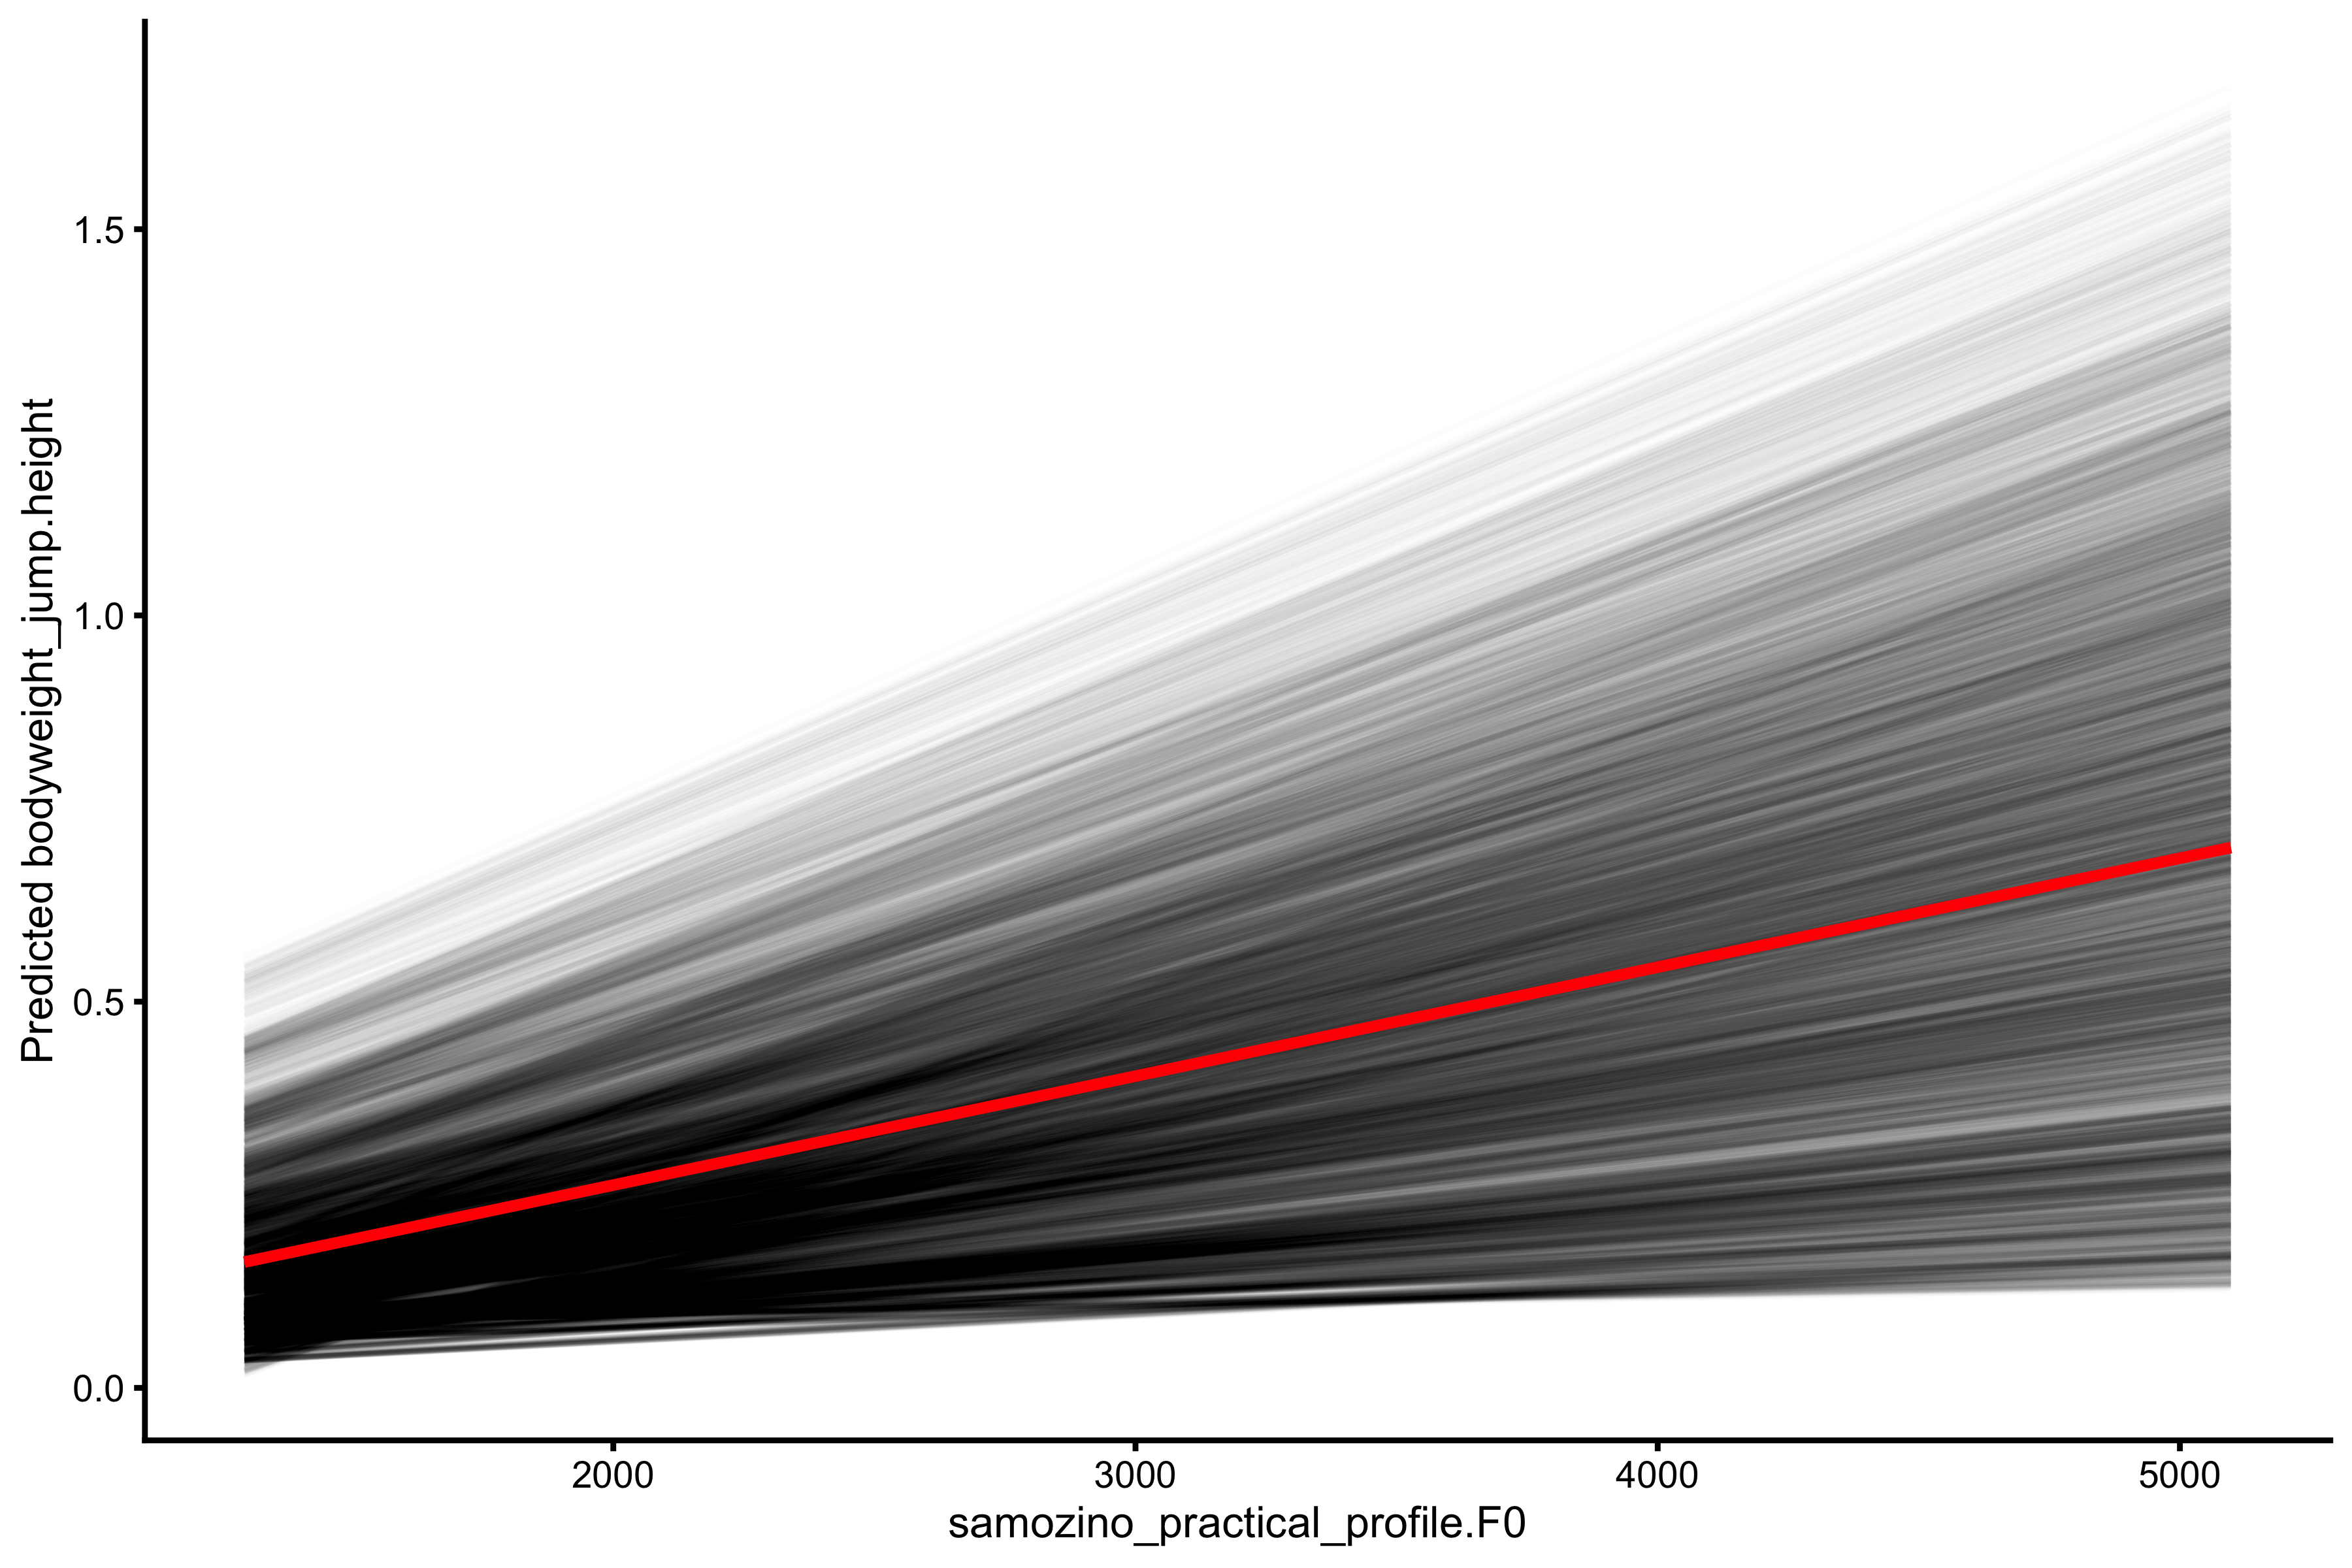
plot_pdp(samozino_height_model, "samozino_practical_profile.V0")
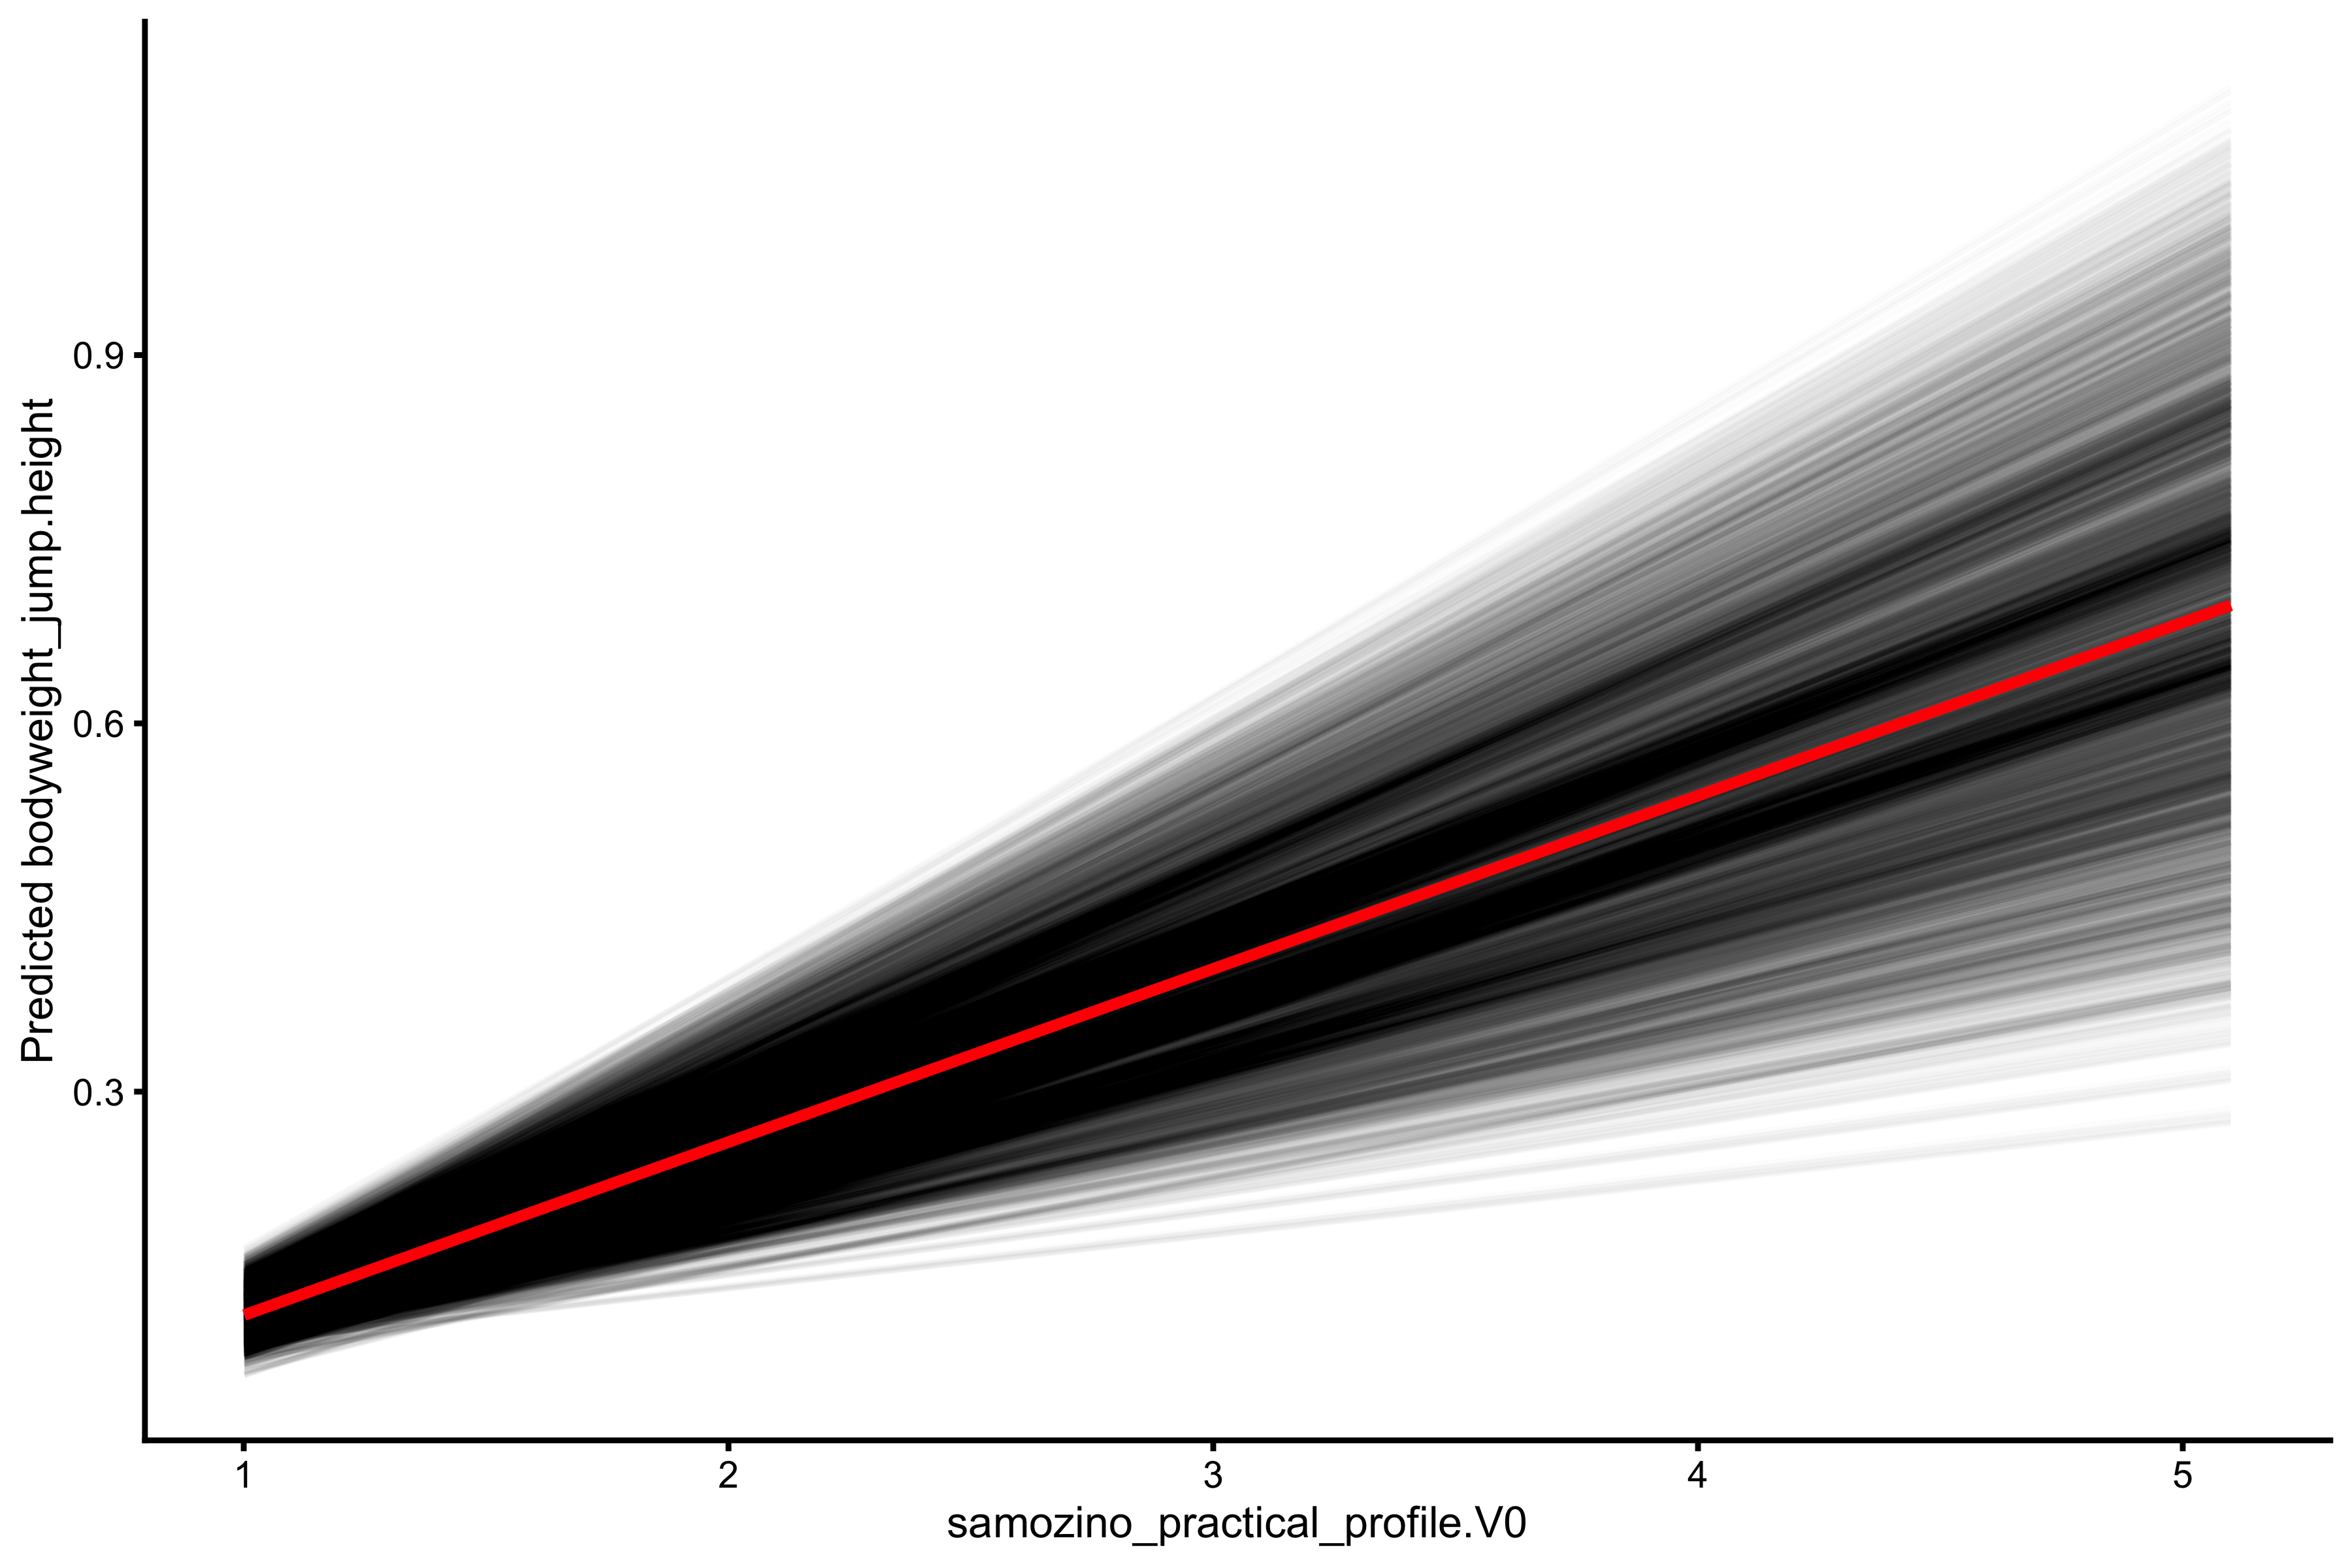
plot_pdp(samozino_height_model, "force_generator.bodyweight")
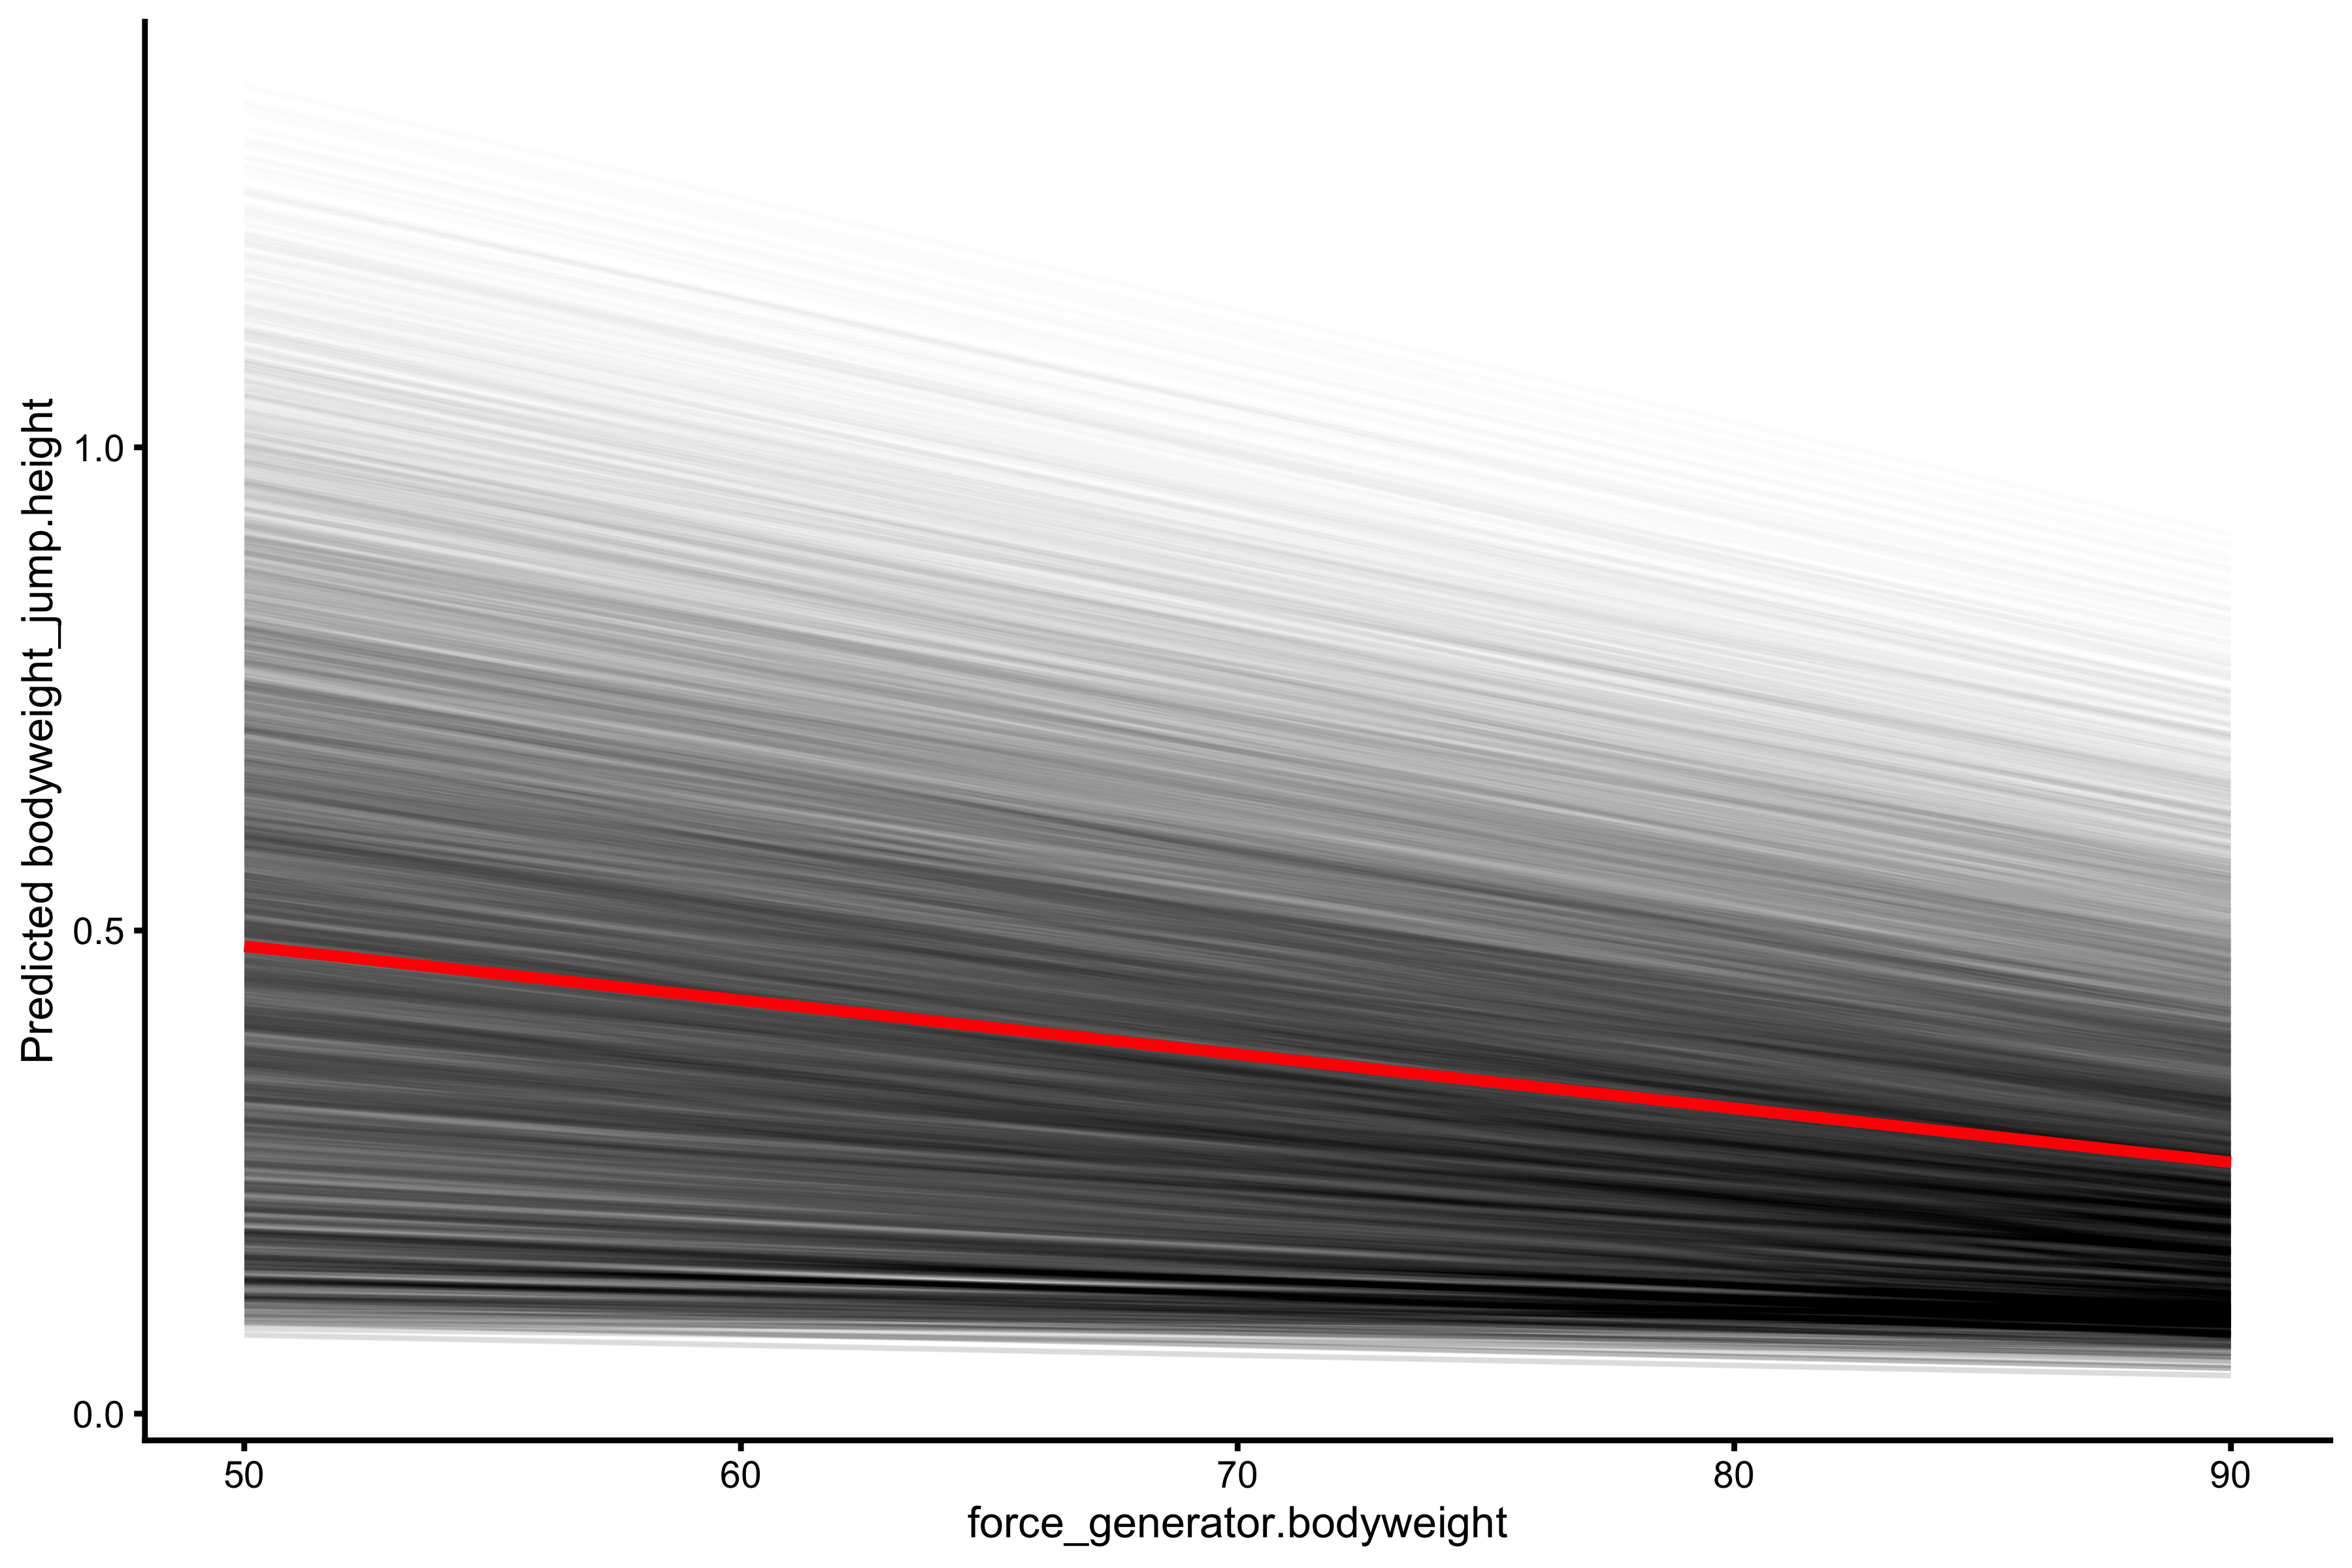
Multivariate model using practical Samozino profile shows great predictive power for predicting vertical jump height.
Exploring intervention probing
If you check PDP+ICE plots for \(F_0\) and \(V_0\), you can see that not all ICE lines are parallel. This implies that for some individuals increasing \(F_0\) and \(V_0\) yields more or less benefit in increasing jump height. This is further discussed in optimization vignette, and it is interesting it showed up in multivariate model as well.
The goal of Samozino’s practical method is to give intervention ideas to practitioners in terms of which side of the FV curve (i.e., \(F_0\) or \(V_0\)) improvements will yield highest improvements in the bodyweight vertical jump. This is very useful information to practitioners. One problem with such information is the following: it doesn’t give us information what is easier to improve. For example, increasing \(V_0\) for 10% that yields higher improvement in vertical jump height compared to 10% improvement in \(F_0\) doesn’t tell us which one is easier or faster (or even safer) to increase. For example, even if increasing \(V_0\) yields higher increase in vertical jump height, maybe increasing \(F_0\) is much simpler, and vice versa. But this is a topic for the end of this vignette.
So far we are interested in validity of such statement/model (which was explored in the optimization vignette). What I have done when I generated vjsim_data is to provide a probing variables (see columns that start with probe_bodyweight_jump.). These are generated by simulating the same jump, but with either 10% better max force, max velocity, or time to max activation (Force Generator characteristic). Variable probe_bodyweight_jump.velocity_to_force_height_ratio contains the ratio between improvements in jump height when max velocity is improved to improvements in jump height when max force is improved:
\[ height \; ratio = \frac{height_{10\%velocity} - height}{height_{10\%force} - height} \]
Thus probe_bodyweight_jump.velocity_to_force_height_ratio represents some type of an index which Force Generator characteristic (either force or velocity) improvement yields more improvement in jump height. Let’s plot this variable against samozino_practical_profile.Sfv_perc (see optimization vignette for more details):
plot_relationship(
  "samozino_practical_profile.Sfv_perc",
  "probe_bodyweight_jump.velocity_to_force_height_ratio"
)
#> $graph

#>
#> $R_squared
#> [1] 0.9295965

probing_Sfv_perc <- regression_model(
  data = vjsim_data,
  target = "probe_bodyweight_jump.velocity_to_force_height_ratio",
  predictors = c(
    "samozino_practical_profile.Sfv_perc"
  ),
  interactions = TRUE, var_imp = "firm"
)


probing_Sfv_perc$graph
The relationship between the two is outstanding. Although the prediction is not ideal (given SESOI of SDx0.2), this is very interesting and confirmatory insight. Let’s repeat the same, but this time for the ratio between max velocity and time to max activation improvement:
plot_relationship(
  "samozino_practical_profile.Sfv_perc",
  "probe_bodyweight_jump.velocity_to_activation_height_ratio"
)
#> $graph

#>
#> $R_squared
#> [1] 1.198197e-08

probing_Sfv_perc <- regression_model(
  data = vjsim_data,
  target = "probe_bodyweight_jump.velocity_to_activation_height_ratio",
  predictors = c(
    "samozino_practical_profile.Sfv_perc"
  ),
  interactions = TRUE, var_imp = "firm"
)


probing_Sfv_perc$graph
The practical Samozino is not able to pick-up improvements between max velocity and time to max activation. Let’s check the relationship with ratio between max force and time to max activation improvements:
plot_relationship(
  "samozino_practical_profile.Sfv_perc",
  "probe_bodyweight_jump.force_to_activation_height_ratio"
)
#> $graph

#>
#> $R_squared
#> [1] 6.990933e-05

probing_Sfv_perc <- regression_model(
  data = vjsim_data,
  target = "probe_bodyweight_jump.force_to_activation_height_ratio",
  predictors = c(
    "samozino_practical_profile.Sfv_perc"
  ),
  interactions = TRUE, var_imp = "firm"
)


probing_Sfv_perc$graph
Again, very bad prediction by the model. This implies that Samozino model was able to (only) predict (with a very decent amount) the intervention effects of increasing max force or max velocity of the Force Generator, thus give insights with one will give more benefits.
Let’s see how other optimization models perform. Let’s check the “simple model” (see optimization vignette for more details):
plot_relationship(
  "simple_profile.Sfv_perc",
  "probe_bodyweight_jump.velocity_to_force_height_ratio"
)
#> $graph

#>
#> $R_squared
#> [1] 0.2273651

probing_simple_Sfv_perc <- regression_model(
  data = vjsim_data,
  target = "probe_bodyweight_jump.velocity_to_force_height_ratio",
  predictors = c(
    "simple_profile.Sfv_perc"
  ),
  interactions = TRUE, var_imp = "firm"
)


probing_simple_Sfv_perc$graph
And for other two ratios:
plot_relationship(
  "simple_profile.Sfv_perc",
  "probe_bodyweight_jump.velocity_to_activation_height_ratio"
)
#> $graph

#>
#> $R_squared
#> [1] 0.0003882336

probing_simple_Sfv_perc <- regression_model(
  data = vjsim_data,
  target = "probe_bodyweight_jump.velocity_to_activation_height_ratio",
  predictors = c(
    "simple_profile.Sfv_perc"
  ),
  interactions = TRUE, var_imp = "firm"
)


probing_simple_Sfv_perc$graph
plot_relationship(
  "simple_profile.Sfv_perc",
  "probe_bodyweight_jump.force_to_activation_height_ratio"
)
#> $graph

#>
#> $R_squared
#> [1] 2.290225e-05

probing_simple_Sfv_perc <- regression_model(
  data = vjsim_data,
  target = "probe_bodyweight_jump.force_to_activation_height_ratio",
  predictors = c(
    "simple_profile.Sfv_perc"
  ),
  interactions = TRUE, var_imp = "firm"
)


probing_simple_Sfv_perc$graph
This implies that the simple optimization model is useless in predicting intervention effects.
Let’s now turn to Load~Peak Force profile (see optimization vignette for more details). Since this profile doesn’t give us any idea what quality needs to be improved, let’s check how it is related to improvements in height when max force, max velocity, or time to max activation is improved for 10%:
plot_relationship(
  "LPF_profile.slope",
  "probe_bodyweight_jump.force_height_ratio"
)
#> $graph

#>
#> $R_squared
#> [1] 0.5804511plot_relationship( "LPF_profile.slope", "probe_bodyweight_jump.velocity_height_ratio" ) #> $graph

#>
#> $R_squared
#> [1] 0.2331085plot_relationship( "LPF_profile.slope", "probe_bodyweight_jump.activation_height_ratio" ) #> $graph

#>
#> $R_squared
#> [1] 0.0919479
It seems that LPF slope give imperfect hints only for effects of improving max force, but nothing else.
Modeling
Let’s see if we can predict samozino_practical_profile.Sfv_perc from probing variables:
probing_samozino <- regression_model(
  data = vjsim_data,
  target = "samozino_practical_profile.Sfv_perc",
  predictors = c(
    "probe_bodyweight_jump.velocity_to_force_height_ratio",
    "probe_bodyweight_jump.velocity_to_activation_height_ratio",
    "probe_bodyweight_jump.force_to_activation_height_ratio"
  ),
  interactions = FALSE, var_imp = "firm"
)

probing_samozino$summary
#>
#> Call:
#> lm(formula = as.formula(paste(target, interactions_string)),
#>     data = model_df)
#>
#> Residuals:
#>     Min      1Q  Median      3Q     Max
#> -58.315  -7.731  -0.396   8.166  68.139
#>
#> Coefficients:
#>                                                             Estimate Std. Error
#> (Intercept)                                                3.279e+01  3.051e-01
#> probe_bodyweight_jump.velocity_to_force_height_ratio       5.420e+01  1.605e-01
#> probe_bodyweight_jump.velocity_to_activation_height_ratio -5.259e-05  1.770e-04
#> probe_bodyweight_jump.force_to_activation_height_ratio     1.387e-04  2.196e-04
#>                                                           t value Pr(>|t|)
#> (Intercept)                                               107.469   <2e-16 ***
#> probe_bodyweight_jump.velocity_to_force_height_ratio      337.640   <2e-16 ***
#> probe_bodyweight_jump.velocity_to_activation_height_ratio  -0.297    0.766
#> probe_bodyweight_jump.force_to_activation_height_ratio      0.632    0.528
#> ---
#> Signif. codes:  0 '***' 0.001 '**' 0.01 '*' 0.05 '.' 0.1 ' ' 1
#>
#> Residual standard error: 15.51 on 8636 degrees of freedom
#> Multiple R-squared:  0.9296, Adjusted R-squared:  0.9296
#> F-statistic: 3.801e+04 on 3 and 8636 DF,  p-value: < 2.2e-16
probing_samozino$graph

probing_samozino$var_imp

plot_pdp(probing_samozino, "probe_bodyweight_jump.velocity_to_force_height_ratio")
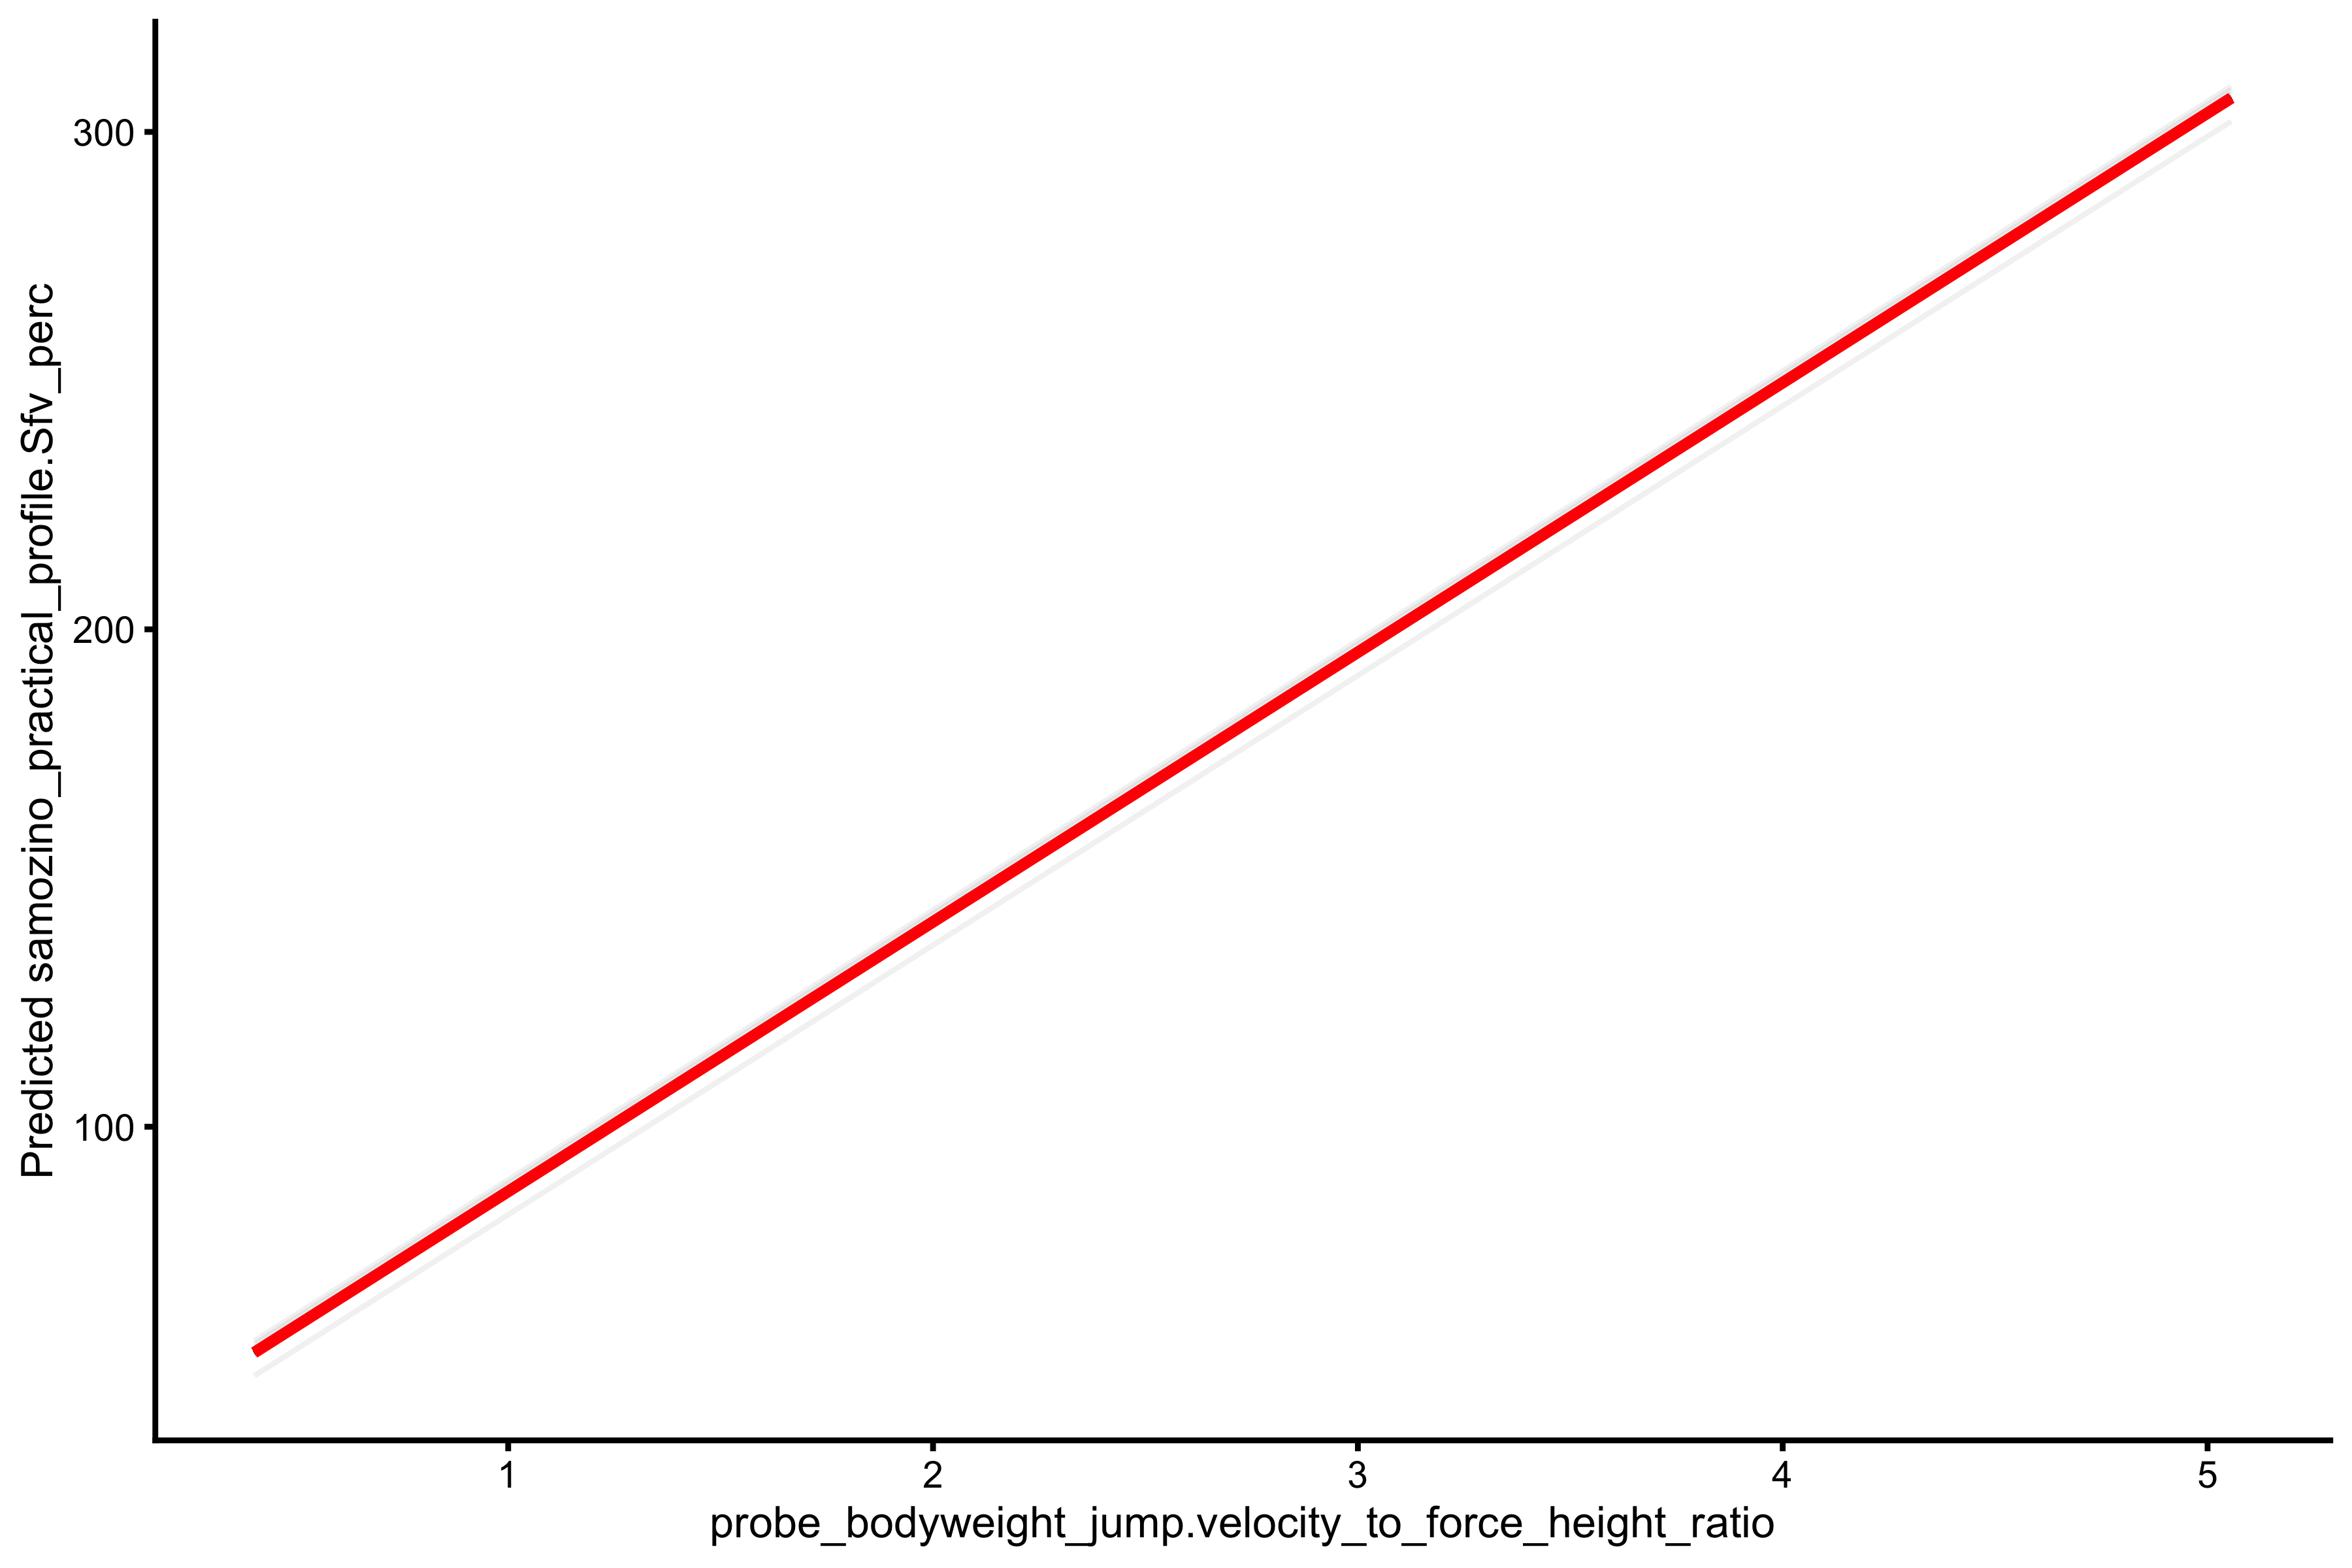
This simple model concludes that samozino_practical_profile.Sfv_perc can give us glimpses into which intervention should be done (i.e., improving max force or max velocity).
Let’s do the same for LPF slope:
probing_LPF_slope <- regression_model(
  data = vjsim_data,
  target = "LPF_profile.slope",
  predictors = c(
    "probe_bodyweight_jump.velocity_height_ratio",
    "probe_bodyweight_jump.force_height_ratio",
    "probe_bodyweight_jump.activation_height_ratio"
  ),
  interactions = FALSE, var_imp = "firm"
)

probing_LPF_slope$summary
#>
#> Call:
#> lm(formula = as.formula(paste(target, interactions_string)),
#>     data = model_df)
#>
#> Residuals:
#>     Min      1Q  Median      3Q     Max
#> -5.7939 -0.8850  0.2009  1.0639  4.3388
#>
#> Coefficients:
#>                                               Estimate Std. Error t value
#> (Intercept)                                   -78.2235     3.6106  -21.66
#> probe_bodyweight_jump.velocity_height_ratio    13.6226     0.3722   36.60
#> probe_bodyweight_jump.force_height_ratio      -92.2693     1.1601  -79.53
#> probe_bodyweight_jump.activation_height_ratio 170.0740     2.7265   62.38
#>                                               Pr(>|t|)
#> (Intercept)                                     <2e-16 ***
#> probe_bodyweight_jump.velocity_height_ratio     <2e-16 ***
#> probe_bodyweight_jump.force_height_ratio        <2e-16 ***
#> probe_bodyweight_jump.activation_height_ratio   <2e-16 ***
#> ---
#> Signif. codes:  0 '***' 0.001 '**' 0.01 '*' 0.05 '.' 0.1 ' ' 1
#>
#> Residual standard error: 1.507 on 8636 degrees of freedom
#> Multiple R-squared:  0.7126, Adjusted R-squared:  0.7125
#> F-statistic:  7137 on 3 and 8636 DF,  p-value: < 2.2e-16
probing_LPF_slope$graph

probing_LPF_slope$var_imp
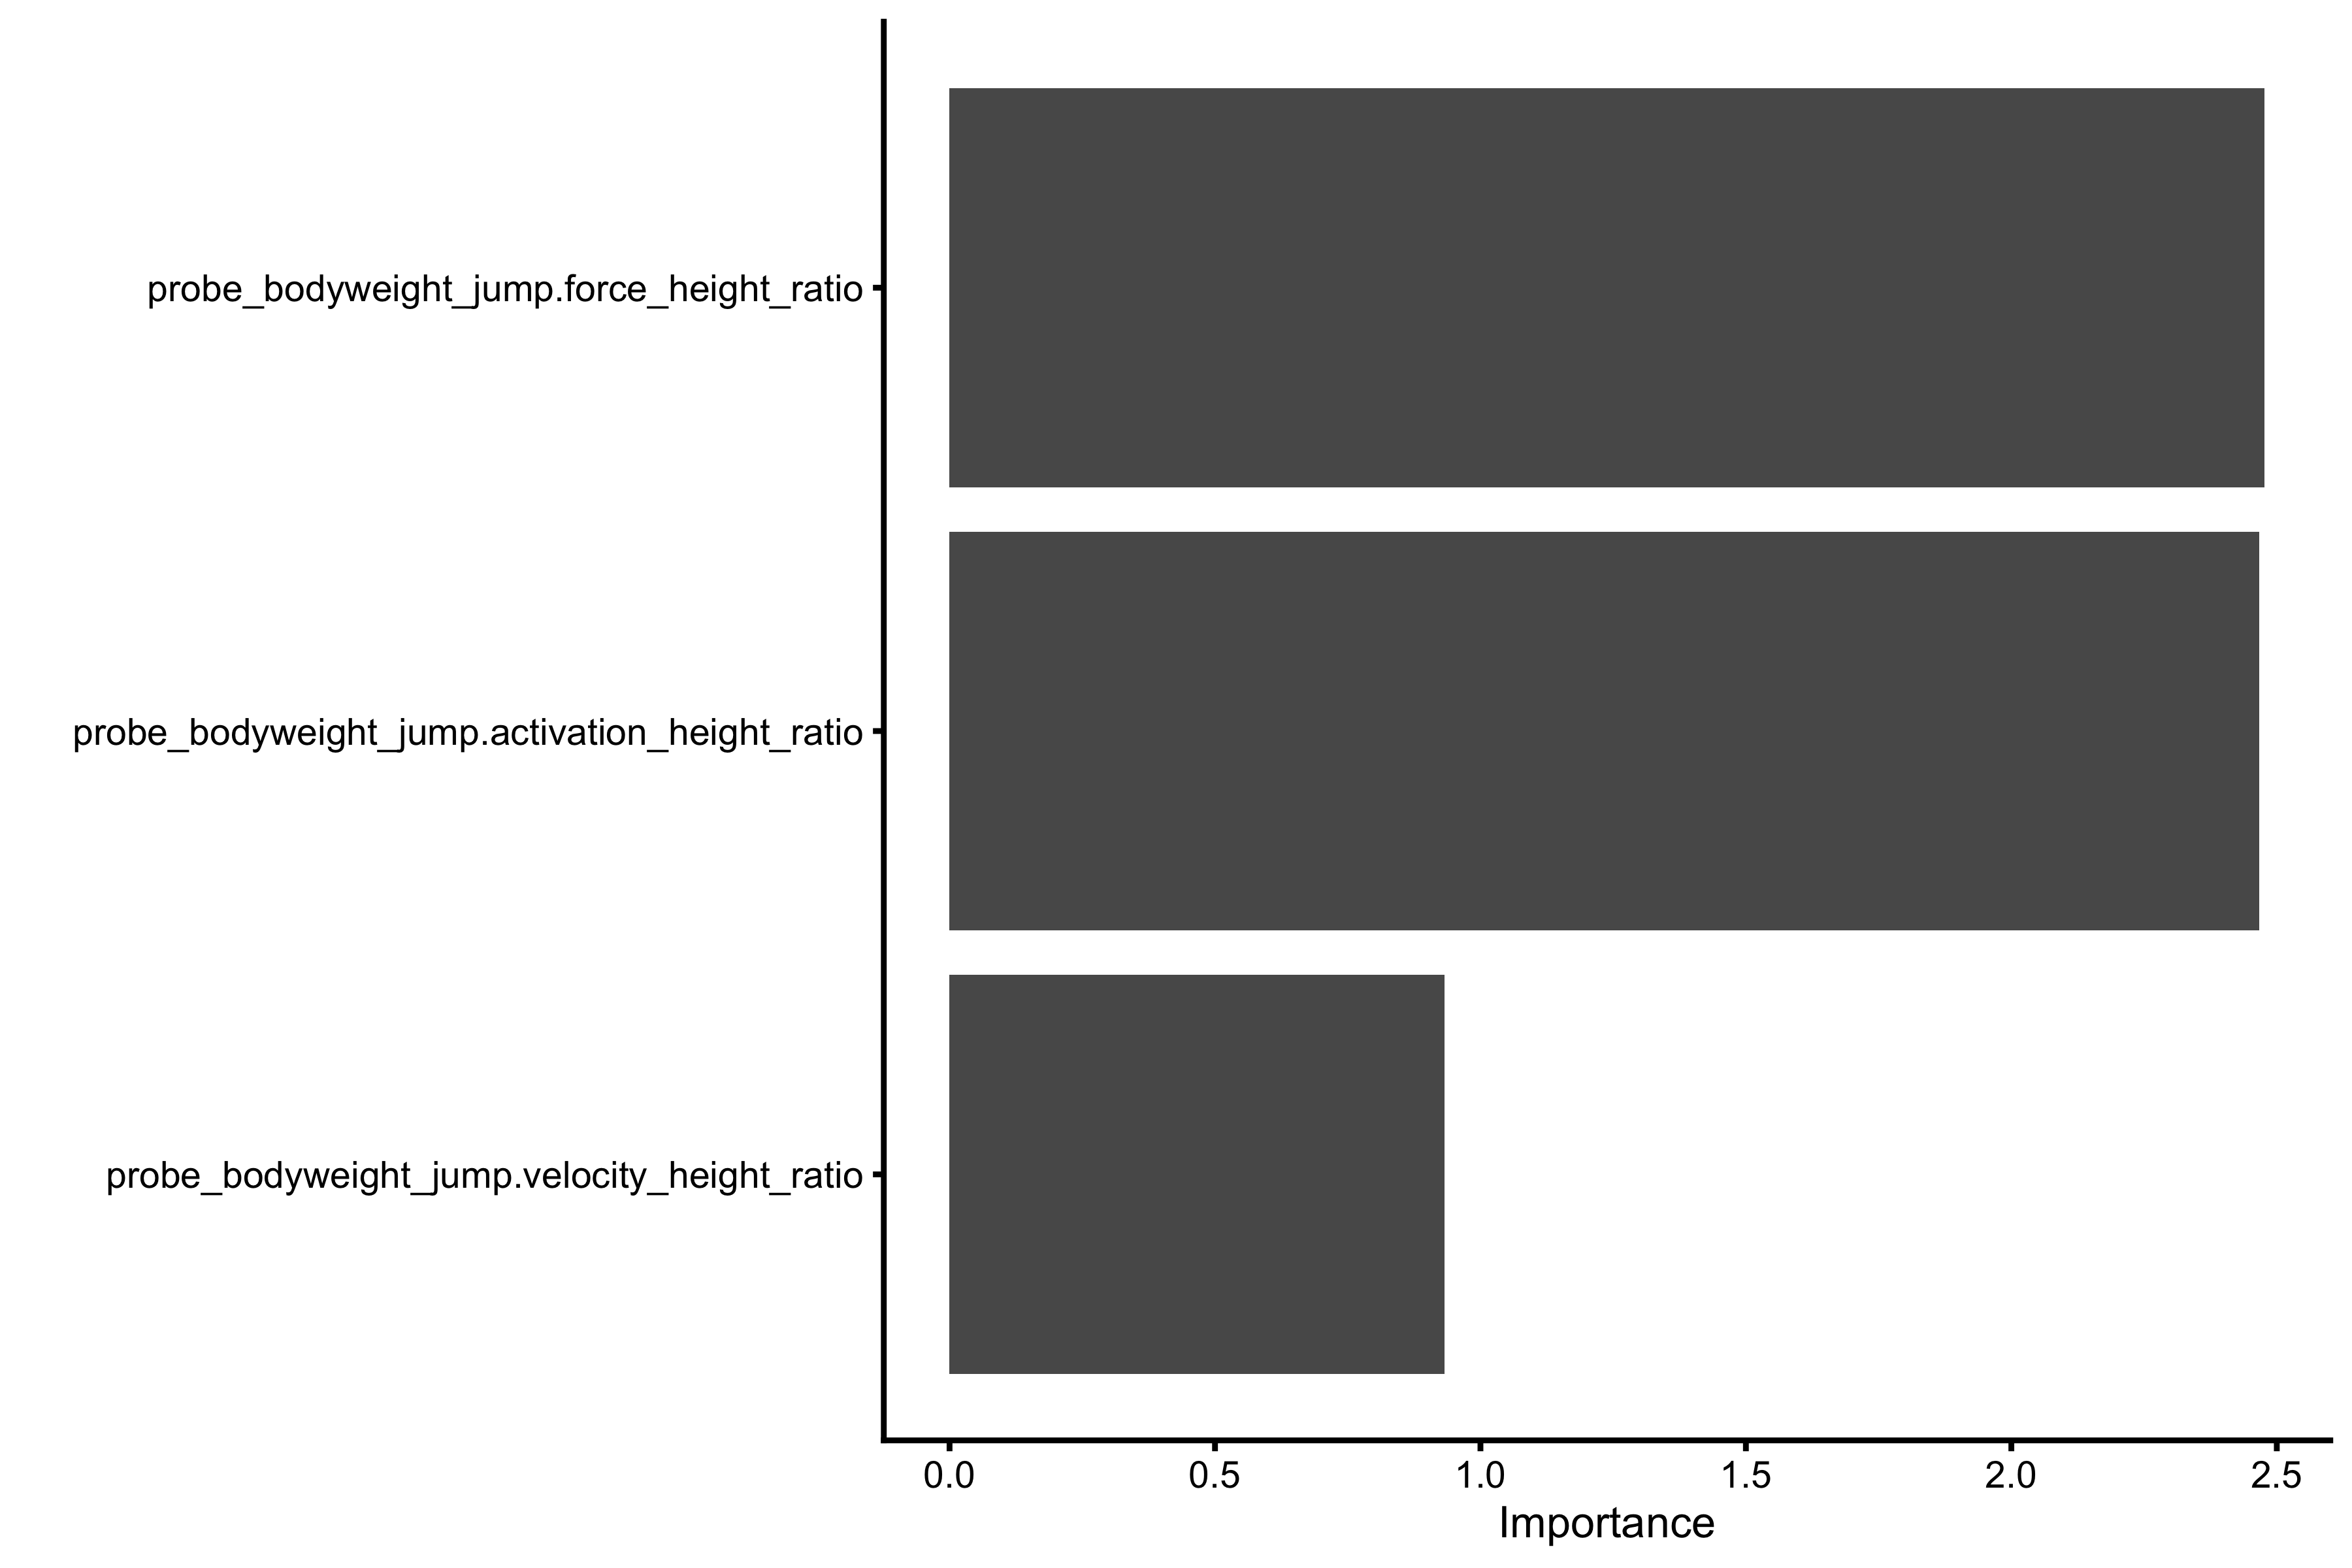
And using the ratios:
probing_LPF_slope <- regression_model(
  data = vjsim_data,
  target = "LPF_profile.slope",
  predictors = c(
    "probe_bodyweight_jump.velocity_to_force_height_ratio",
    "probe_bodyweight_jump.velocity_to_activation_height_ratio",
    "probe_bodyweight_jump.force_to_activation_height_ratio"
  ),
  interactions = FALSE, var_imp = "firm"
)

probing_LPF_slope$summary
#>
#> Call:
#> lm(formula = as.formula(paste(target, interactions_string)),
#>     data = model_df)
#>
#> Residuals:
#>     Min      1Q  Median      3Q     Max
#> -6.1087 -1.7631  0.0206  1.6652  5.6566
#>
#> Coefficients:
#>                                                             Estimate Std. Error
#> (Intercept)                                                4.938e+00  4.407e-02
#> probe_bodyweight_jump.velocity_to_force_height_ratio       1.631e+00  2.319e-02
#> probe_bodyweight_jump.velocity_to_activation_height_ratio -9.707e-05  2.556e-05
#> probe_bodyweight_jump.force_to_activation_height_ratio     9.323e-05  3.172e-05
#>                                                           t value Pr(>|t|)
#> (Intercept)                                               112.045  < 2e-16 ***
#> probe_bodyweight_jump.velocity_to_force_height_ratio       70.346  < 2e-16 ***
#> probe_bodyweight_jump.velocity_to_activation_height_ratio  -3.797 0.000147 ***
#> probe_bodyweight_jump.force_to_activation_height_ratio      2.939 0.003303 **
#> ---
#> Signif. codes:  0 '***' 0.001 '**' 0.01 '*' 0.05 '.' 0.1 ' ' 1
#>
#> Residual standard error: 2.24 on 8636 degrees of freedom
#> Multiple R-squared:  0.3654, Adjusted R-squared:  0.3652
#> F-statistic:  1657 on 3 and 8636 DF,  p-value: < 2.2e-16
probing_LPF_slope$graph

probing_LPF_slope$var_imp

Unfortunately, LPF slope does not provide insight to which intervention should be done to improve the vertical jump height.
Bosco Index is another measure that is used to indicate whether someone needs to work on “speed” or “force” qualities. Let’s see how is it associated with aforementioned vjsim interventions:
plot_relationship(
  "bosco.index",
  "probe_bodyweight_jump.force_height_ratio"
)
#> $graph

#>
#> $R_squared
#> [1] 0.5274059plot_relationship( "bosco.index", "probe_bodyweight_jump.velocity_height_ratio" ) #> $graph

#>
#> $R_squared
#> [1] 0.0009284794plot_relationship( "bosco.index", "probe_bodyweight_jump.activation_height_ratio" ) #> $graph

#>
#> $R_squared
#> [1] 0.03715357
It looks like Bosco Index has a similar relationship with max force increments as LPF slope. Let’s check the relationship between the two:
plot_relationship(
  "bosco.index",
  "LPF_profile.slope"
)
#> $graph

#>
#> $R_squared
#> [1] 0.2167145
As can be seen from the above graph, these two metrics are not related.
In conclusion, Samozino model was able to predict which would be better intervention to be made (i.e. either increasing max force of max velocity) to increase the vertical jump height. LPF slope was able to less than perfectly predict interventions of max force increase (higher the slope, the lower the effects of increasing max force). Keep in mind that these conclusions are only given the vjsim model and related to improvements in bodyweight vertical jump height. LPF slope and Bosco Index might be useful for other purposes beyond bodyweight vertical jump height.
Exploring variable clustering
Another useful exploration that might be done is factor analysis. This analysis can help us find latent variables that explain the observed metrics (Borsboom 2008, 2009; Borsboom, Mellenbergh, and van Heerden 2003). Rather than performing a proper exploratory and confirmatory factor analysis, I will perform simple and more visual variable clustering (Chavent et al. 2017). Here is the function that perform variable clustering:
var_clust <- function(data, predictors) {
  # Feature clustering
  data <- select_(data, .dots = predictors)
  cluster_model <- hclustvar(data)

  var_clust <- ggdendrogram(as.dendrogram(cluster_model), rotate = TRUE)

  return(list(
    model = cluster_model,
    graph = var_clust
  ))
}
For a start, let’s see how bodyweight jump summary metrics cluster together:
jump_metrics_cluster <- var_clust(
  vjsim_data,
  c(
    "force_generator.bodyweight",
    "bodyweight_jump.take_off_time",
    "bodyweight_jump.take_off_velocity",
    "bodyweight_jump.height",
    "bodyweight_jump.mean_GRF_over_distance",
    "bodyweight_jump.mean_velocity",
    "bodyweight_jump.work_done",
    "bodyweight_jump.impulse",
    "bodyweight_jump.mean_power",
    "bodyweight_jump.mean_RFD",
    "bodyweight_jump.mean_RPD",
    "bodyweight_jump.peak_GRF",
    "bodyweight_jump.peak_velocity",
    "bodyweight_jump.peak_power",
    "bodyweight_jump.peak_RFD",
    "bodyweight_jump.GRF_at_100ms",
    "bodyweight_jump.GRF_at_200ms",
    "bodyweight_jump.peak_RPD"
  )
)

jump_metrics_cluster$graph

Eyeballing the figure above, we can see that there are 2-3 variable clusters (latent variables?):
part <- cutreevar(jump_metrics_cluster$model, 3)
summary(part)
#>
#> Call:
#> cutreevar(obj = jump_metrics_cluster$model, k = 3)
#>
#>
#>
#> Data:
#>    number of observations:  8640
#>    number of variables:  18
#>    number of clusters:  3
#>
#> Cluster  1 :
#>                                        squared loading correlation
#> bodyweight_jump.impulse                           0.97       -0.99
#> bodyweight_jump.mean_GRF_over_distance            0.92       -0.96
#> bodyweight_jump.peak_power                        0.88       -0.94
#> bodyweight_jump.work_done                         0.86       -0.93
#> bodyweight_jump.mean_power                        0.83       -0.91
#> bodyweight_jump.GRF_at_200ms                      0.59       -0.77
#> force_generator.bodyweight                        0.44       -0.66
#>
#>
#> Cluster  2 :
#>                               squared loading correlation
#> bodyweight_jump.peak_RPD                 0.91        0.95
#> bodyweight_jump.mean_RPD                 0.87        0.93
#> bodyweight_jump.peak_GRF                 0.80        0.89
#> bodyweight_jump.peak_RFD                 0.79        0.89
#> bodyweight_jump.GRF_at_100ms             0.76        0.87
#> bodyweight_jump.mean_RFD                 0.73        0.86
#> bodyweight_jump.take_off_time            0.57       -0.75
#>
#>
#> Cluster  3 :
#>                                   squared loading correlation
#> bodyweight_jump.peak_velocity                0.97        0.99
#> bodyweight_jump.take_off_velocity            0.97        0.98
#> bodyweight_jump.height                       0.97        0.98
#> bodyweight_jump.mean_velocity                0.67        0.82
#>
#>
#> Gain in cohesion (in %):  49.78
plot(part)

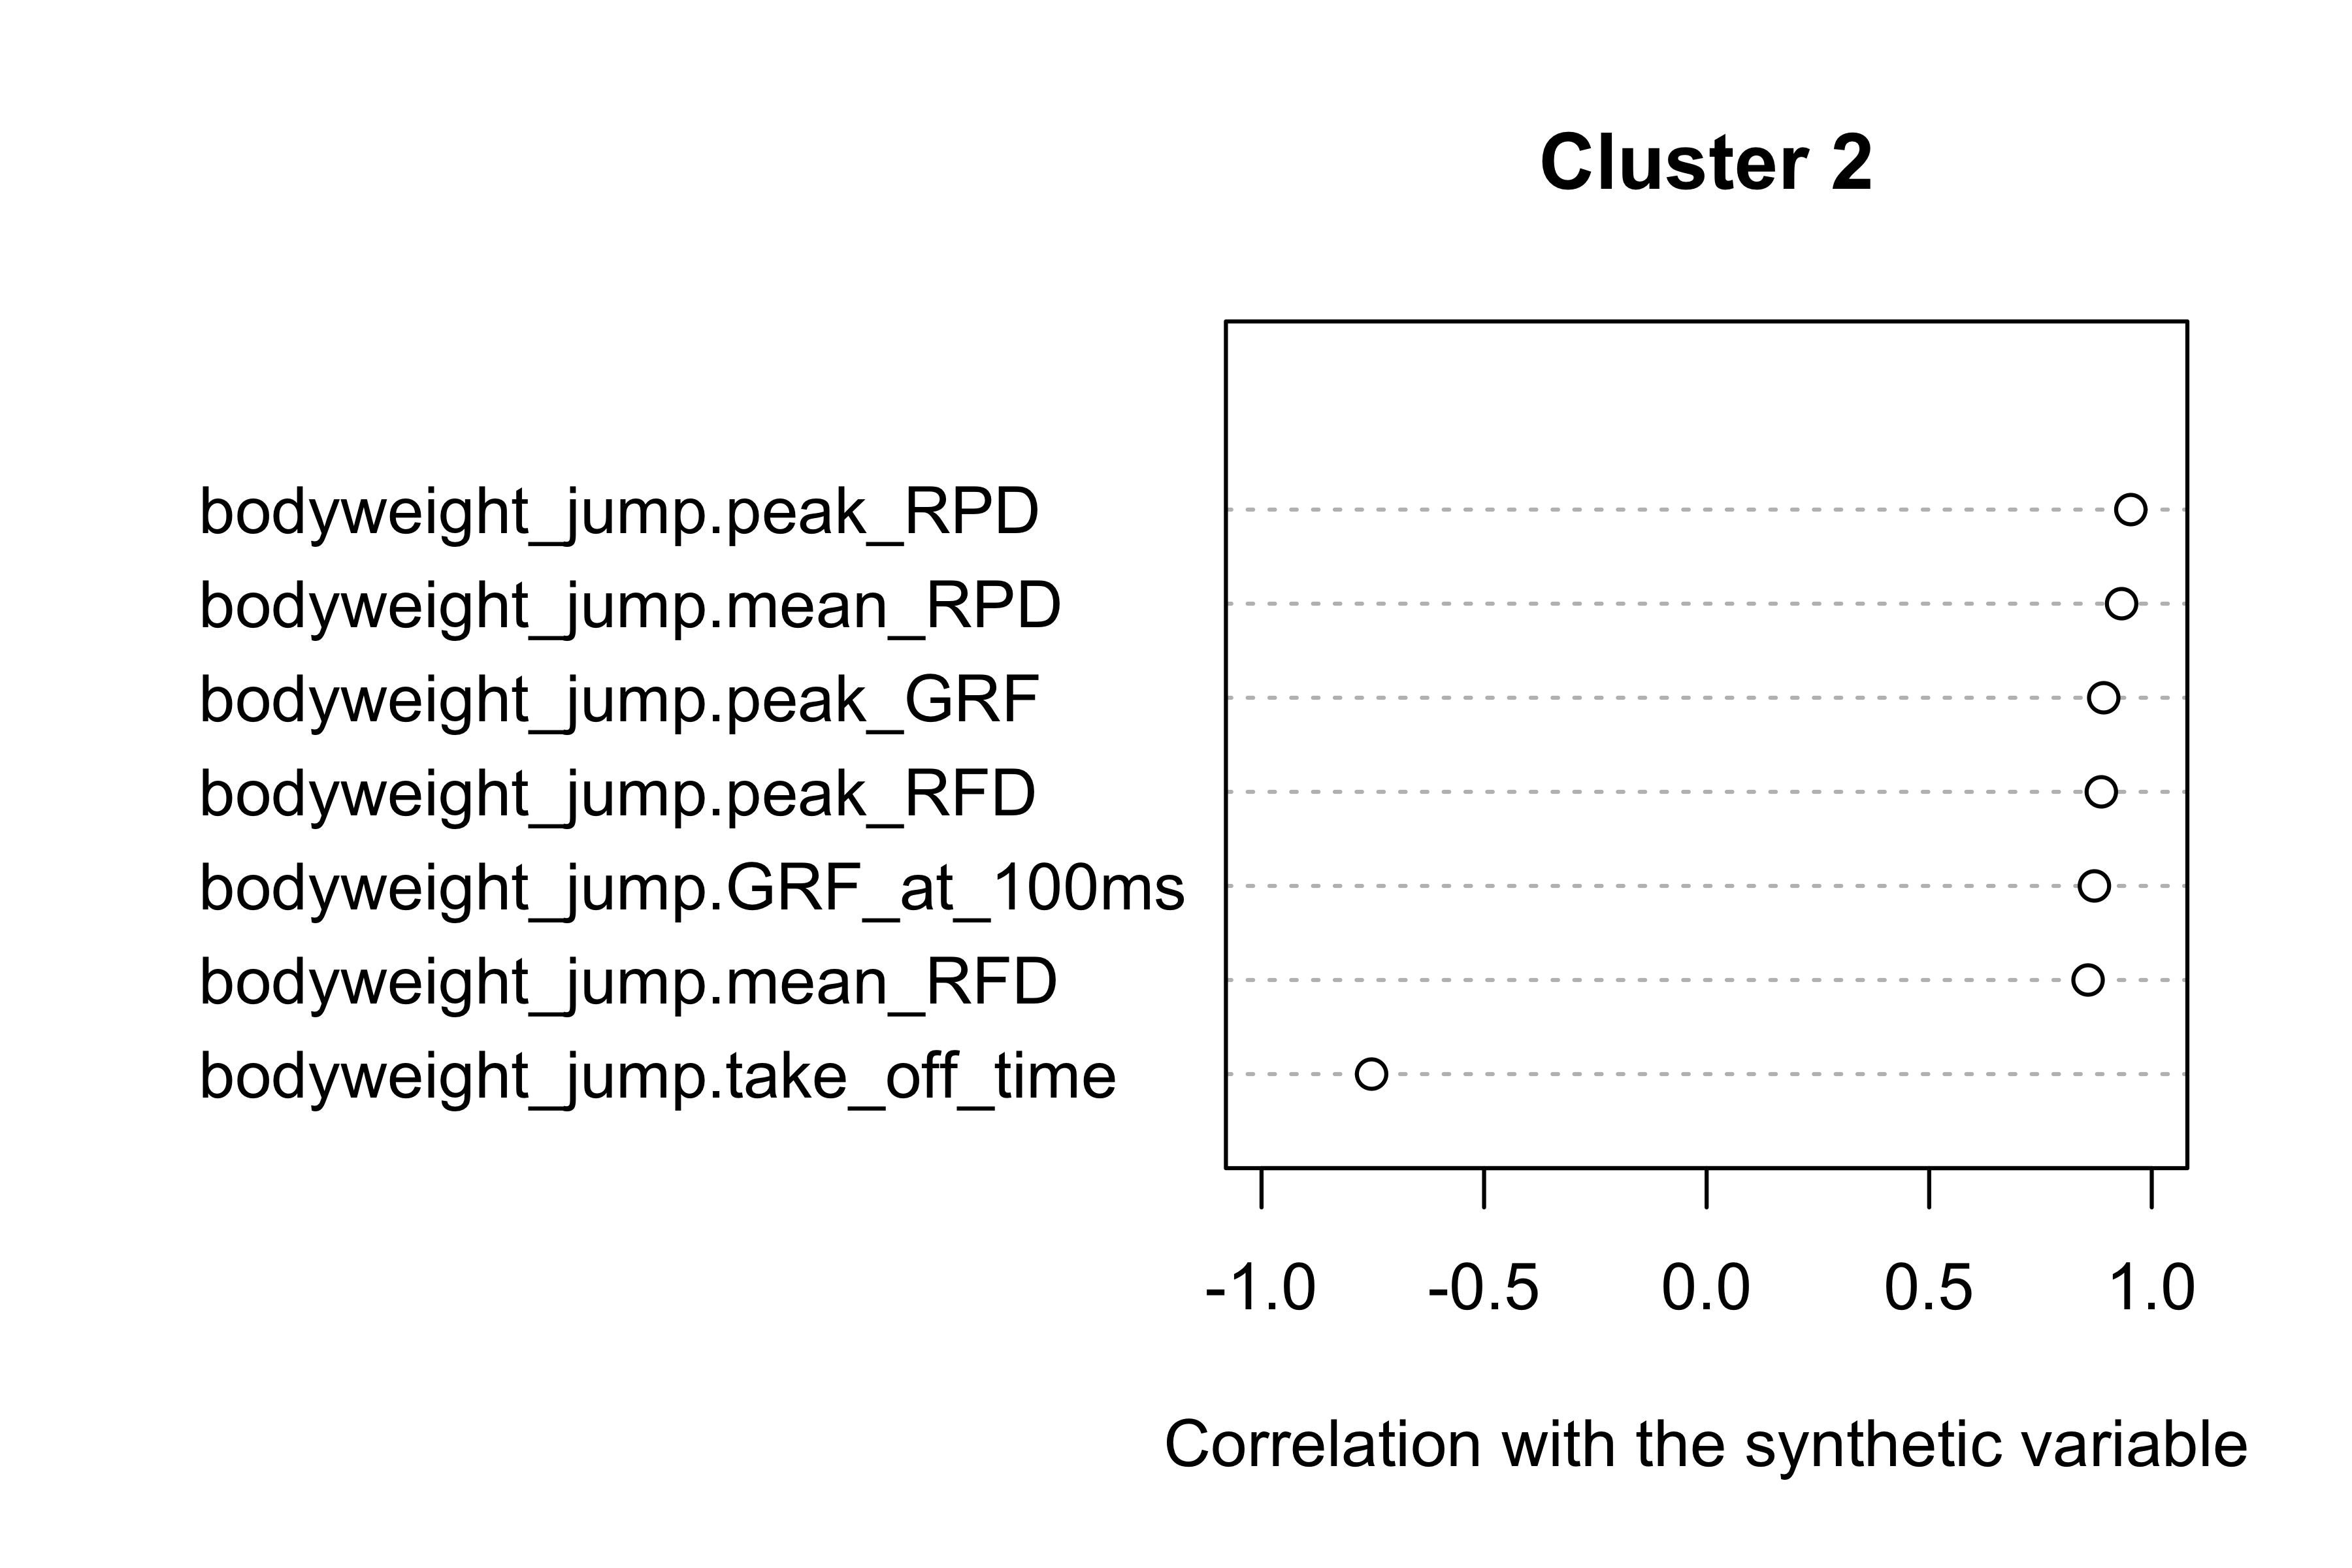
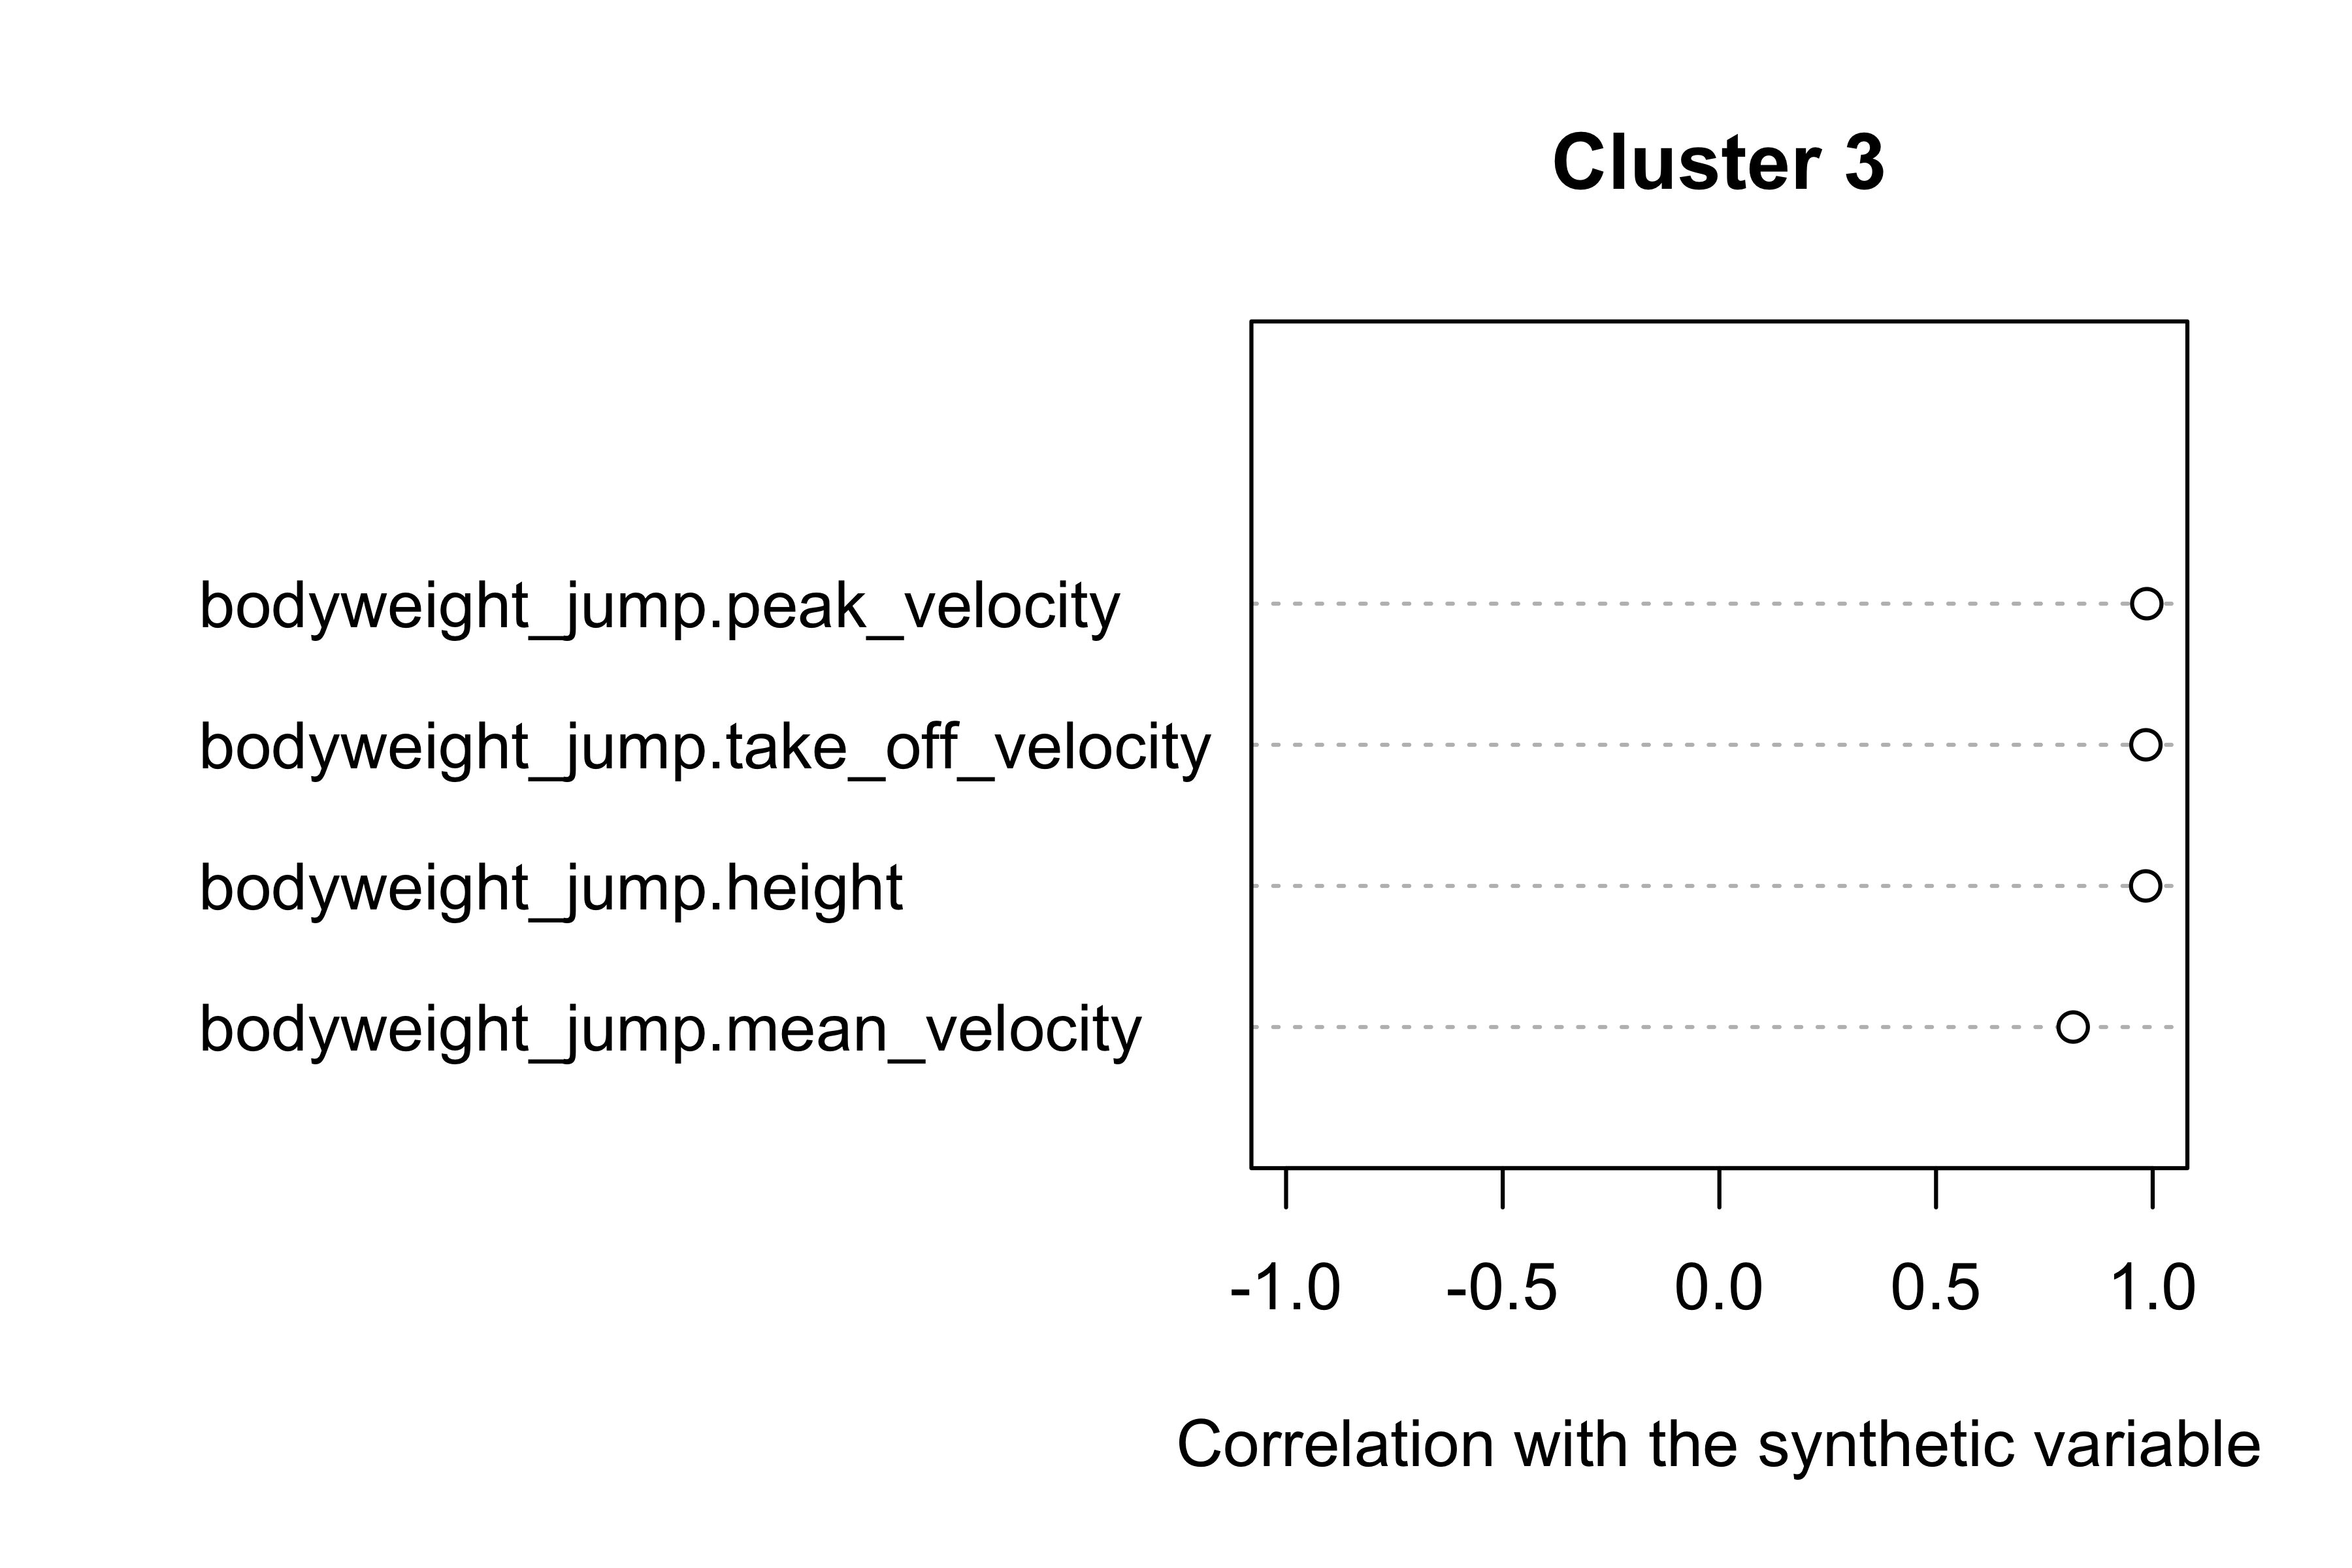
#> $coord.quanti
#> $coord.quanti$Cluster1
#>                                            dim 1
#> force_generator.bodyweight             0.6630546
#> bodyweight_jump.GRF_at_200ms           0.7690410
#> bodyweight_jump.mean_power             0.9096675
#> bodyweight_jump.work_done              0.9264730
#> bodyweight_jump.peak_power             0.9405246
#> bodyweight_jump.mean_GRF_over_distance 0.9605437
#> bodyweight_jump.impulse                0.9870264
#>
#> $coord.quanti$Cluster2
#>                                    dim 1
#> bodyweight_jump.take_off_time -0.7527464
#> bodyweight_jump.mean_RFD       0.8569294
#> bodyweight_jump.GRF_at_100ms   0.8711827
#> bodyweight_jump.peak_RFD       0.8867181
#> bodyweight_jump.peak_GRF       0.8921435
#> bodyweight_jump.mean_RPD       0.9322654
#> bodyweight_jump.peak_RPD       0.9530226
#>
#> $coord.quanti$Cluster3
#>                                       dim 1
#> bodyweight_jump.mean_velocity     0.8165407
#> bodyweight_jump.height            0.9838033
#> bodyweight_jump.take_off_velocity 0.9843257
#> bodyweight_jump.peak_velocity     0.9863779
#>
#>
#> $coord.levels
#> $coord.levels$Cluster1
#> [1] "No categorical variables in this cluster"
#>
#> $coord.levels$Cluster2
#> [1] "No categorical variables in this cluster"
#>
#> $coord.levels$Cluster3
#> [1] "No categorical variables in this cluster"
Power and force metrics can be normalized (divided by bodyweight), but I will leave this to you to explore. So far the three clusters, in my humble opinion, reflect three latent variable:
- Cluster 1: force, work, power and impulse characteristics
- Cluster 2: explosiveness (how quick is the take-off, rate of force and power development)
- Cluster 3: velocity
Let’s see how the profiles cluster together with Force Generator characteristics:
profiles_cluster <- var_clust(
  vjsim_data,
  c(
    # Force Generator characteristics
    # "force_generator.bodyweight",
    "force_generator.push_off_distance",
    "force_generator.max_force",
    "force_generator.max_velocity",
    "force_generator.decline_rate",
    "force_generator.peak_location",
    "force_generator.time_to_max_activation",
    "force_generator.Pmax",
    "force_generator.Sfv",

    # Profiles
    "profile_mean_FV.F0",
    "profile_mean_FV.V0",
    "profile_mean_FV.Pmax",
    "profile_mean_FV.Pmax",
    "profile_mean_FV.Sfv",

    "profile_mean_power.Pmax",

    "profile_peak_FV.F0",
    "profile_peak_FV.V0",
    "profile_peak_FV.Pmax",
    "profile_peak_FV.Sfv",

    "profile_load_take_off_velocity.V0",
    "profile_load_take_off_velocity.L0",
    "profile_load_take_off_velocity.Imax",
    "profile_load_take_off_velocity.Slv",

    "profile_load_impulse.Imax",

    "LPF_profile.slope",
    "samozino_practical_profile.F0",
    "samozino_practical_profile.V0",
    "samozino_practical_profile.Pmax",
    "samozino_practical_profile.Sfv",

    "simple_profile.L0",
    "simple_profile.TOV0",
    "simple_profile.Sfv"
  )
)

profiles_cluster$graph

Here are the list of metrics if 4 clusters are selected:
part <- cutreevar(profiles_cluster$model, 4)
summary(part)
#>
#> Call:
#> cutreevar(obj = profiles_cluster$model, k = 4)
#>
#>
#>
#> Data:
#>    number of observations:  8640
#>    number of variables:  30
#>    number of clusters:  4
#>
#> Cluster  1 :
#>                                        squared loading correlation
#> profile_mean_FV.V0                               0.891        0.94
#> LPF_profile.slope                                0.874       -0.94
#> profile_peak_FV.V0                               0.793        0.89
#> profile_mean_FV.Sfv                              0.750        0.87
#> force_generator.time_to_max_activation           0.489       -0.70
#> force_generator.push_off_distance                0.079        0.28
#> force_generator.decline_rate                     0.024        0.16
#>
#>
#> Cluster  2 :
#>                                   squared loading correlation
#> profile_load_take_off_velocity.L0           0.960      -0.980
#> simple_profile.L0                           0.960      -0.980
#> samozino_practical_profile.F0               0.956      -0.978
#> force_generator.max_force                   0.954      -0.977
#> profile_peak_FV.F0                          0.883      -0.940
#> profile_mean_FV.F0                          0.814      -0.902
#> force_generator.peak_location               0.005      -0.071
#>
#>
#> Cluster  3 :
#>                                    squared loading correlation
#> force_generator.Sfv                           0.93        0.96
#> samozino_practical_profile.Sfv                0.91        0.96
#> profile_load_take_off_velocity.Slv            0.89        0.95
#> simple_profile.Sfv                            0.89        0.95
#> profile_load_take_off_velocity.V0             0.85        0.92
#> simple_profile.TOV0                           0.85        0.92
#> samozino_practical_profile.V0                 0.84        0.92
#> profile_peak_FV.Sfv                           0.83        0.91
#> force_generator.max_velocity                  0.82        0.91
#>
#>
#> Cluster  4 :
#>                                     squared loading correlation
#> profile_mean_power.Pmax                        0.96        0.98
#> profile_mean_FV.Pmax                           0.96        0.98
#> samozino_practical_profile.Pmax                0.95        0.97
#> profile_load_impulse.Imax                      0.94        0.97
#> profile_load_take_off_velocity.Imax            0.94        0.97
#> force_generator.Pmax                           0.93        0.96
#> profile_peak_FV.Pmax                           0.88        0.94
#>
#>
#> Gain in cohesion (in %):  62.21
plot(part)

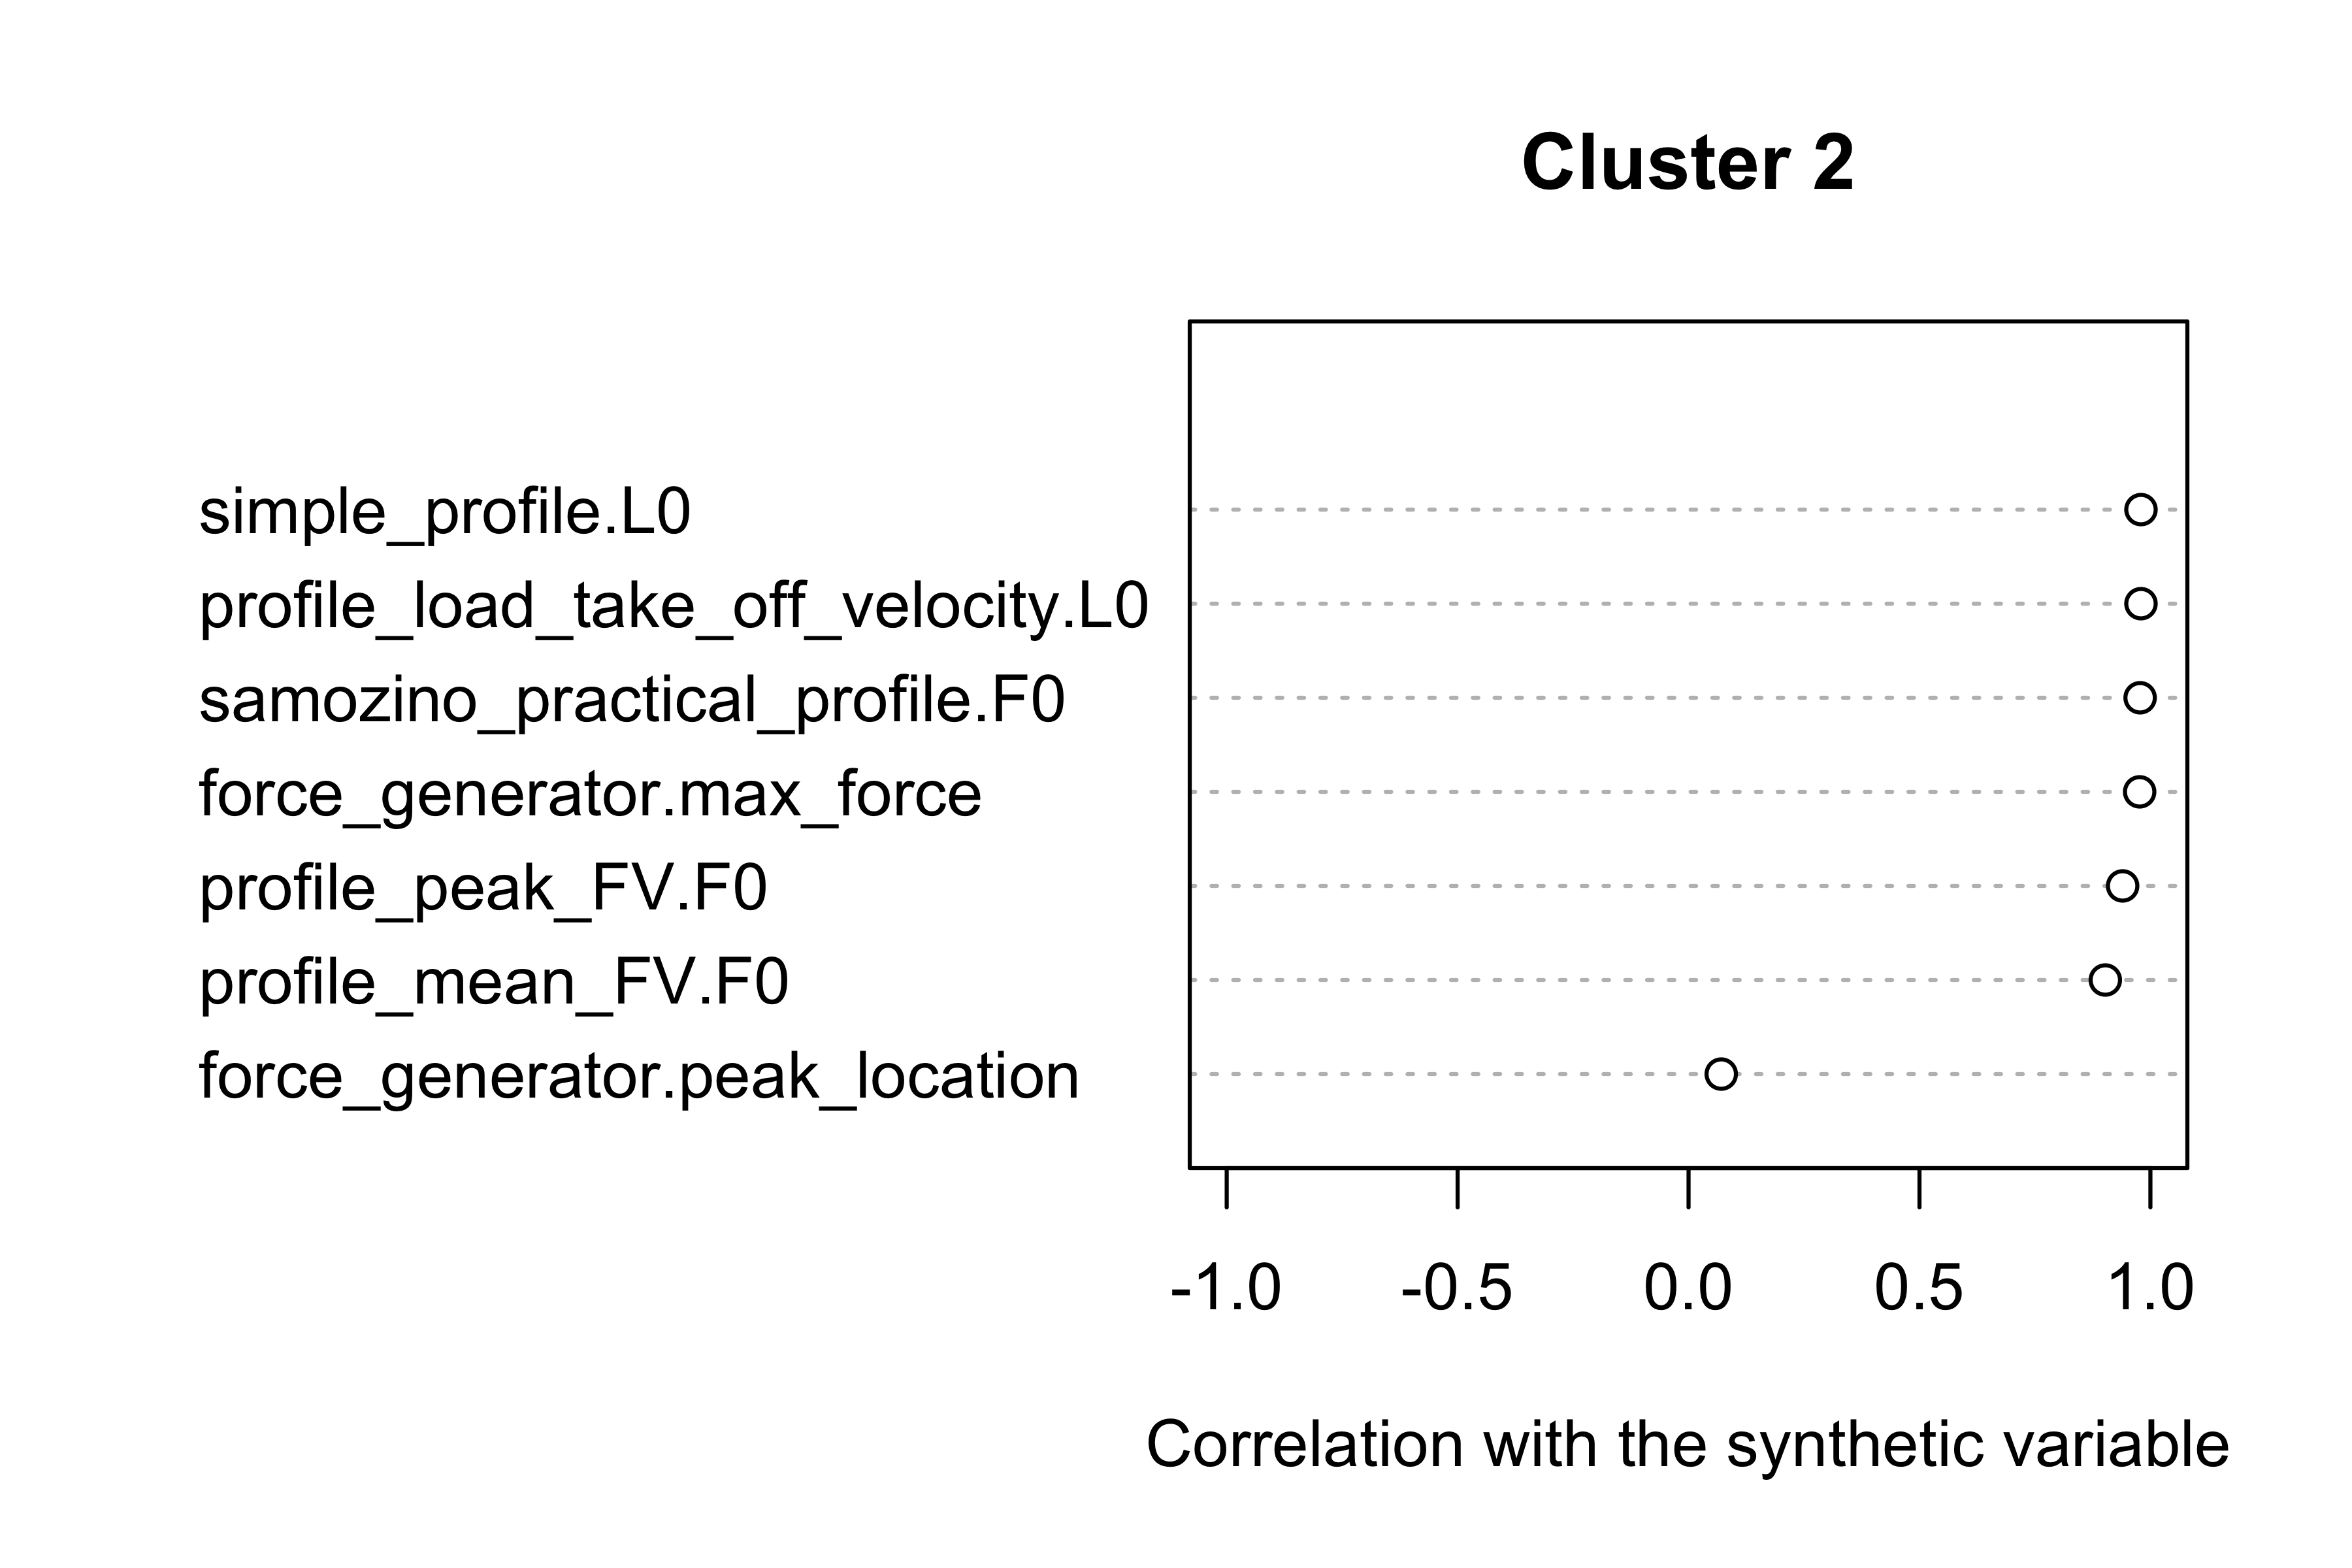
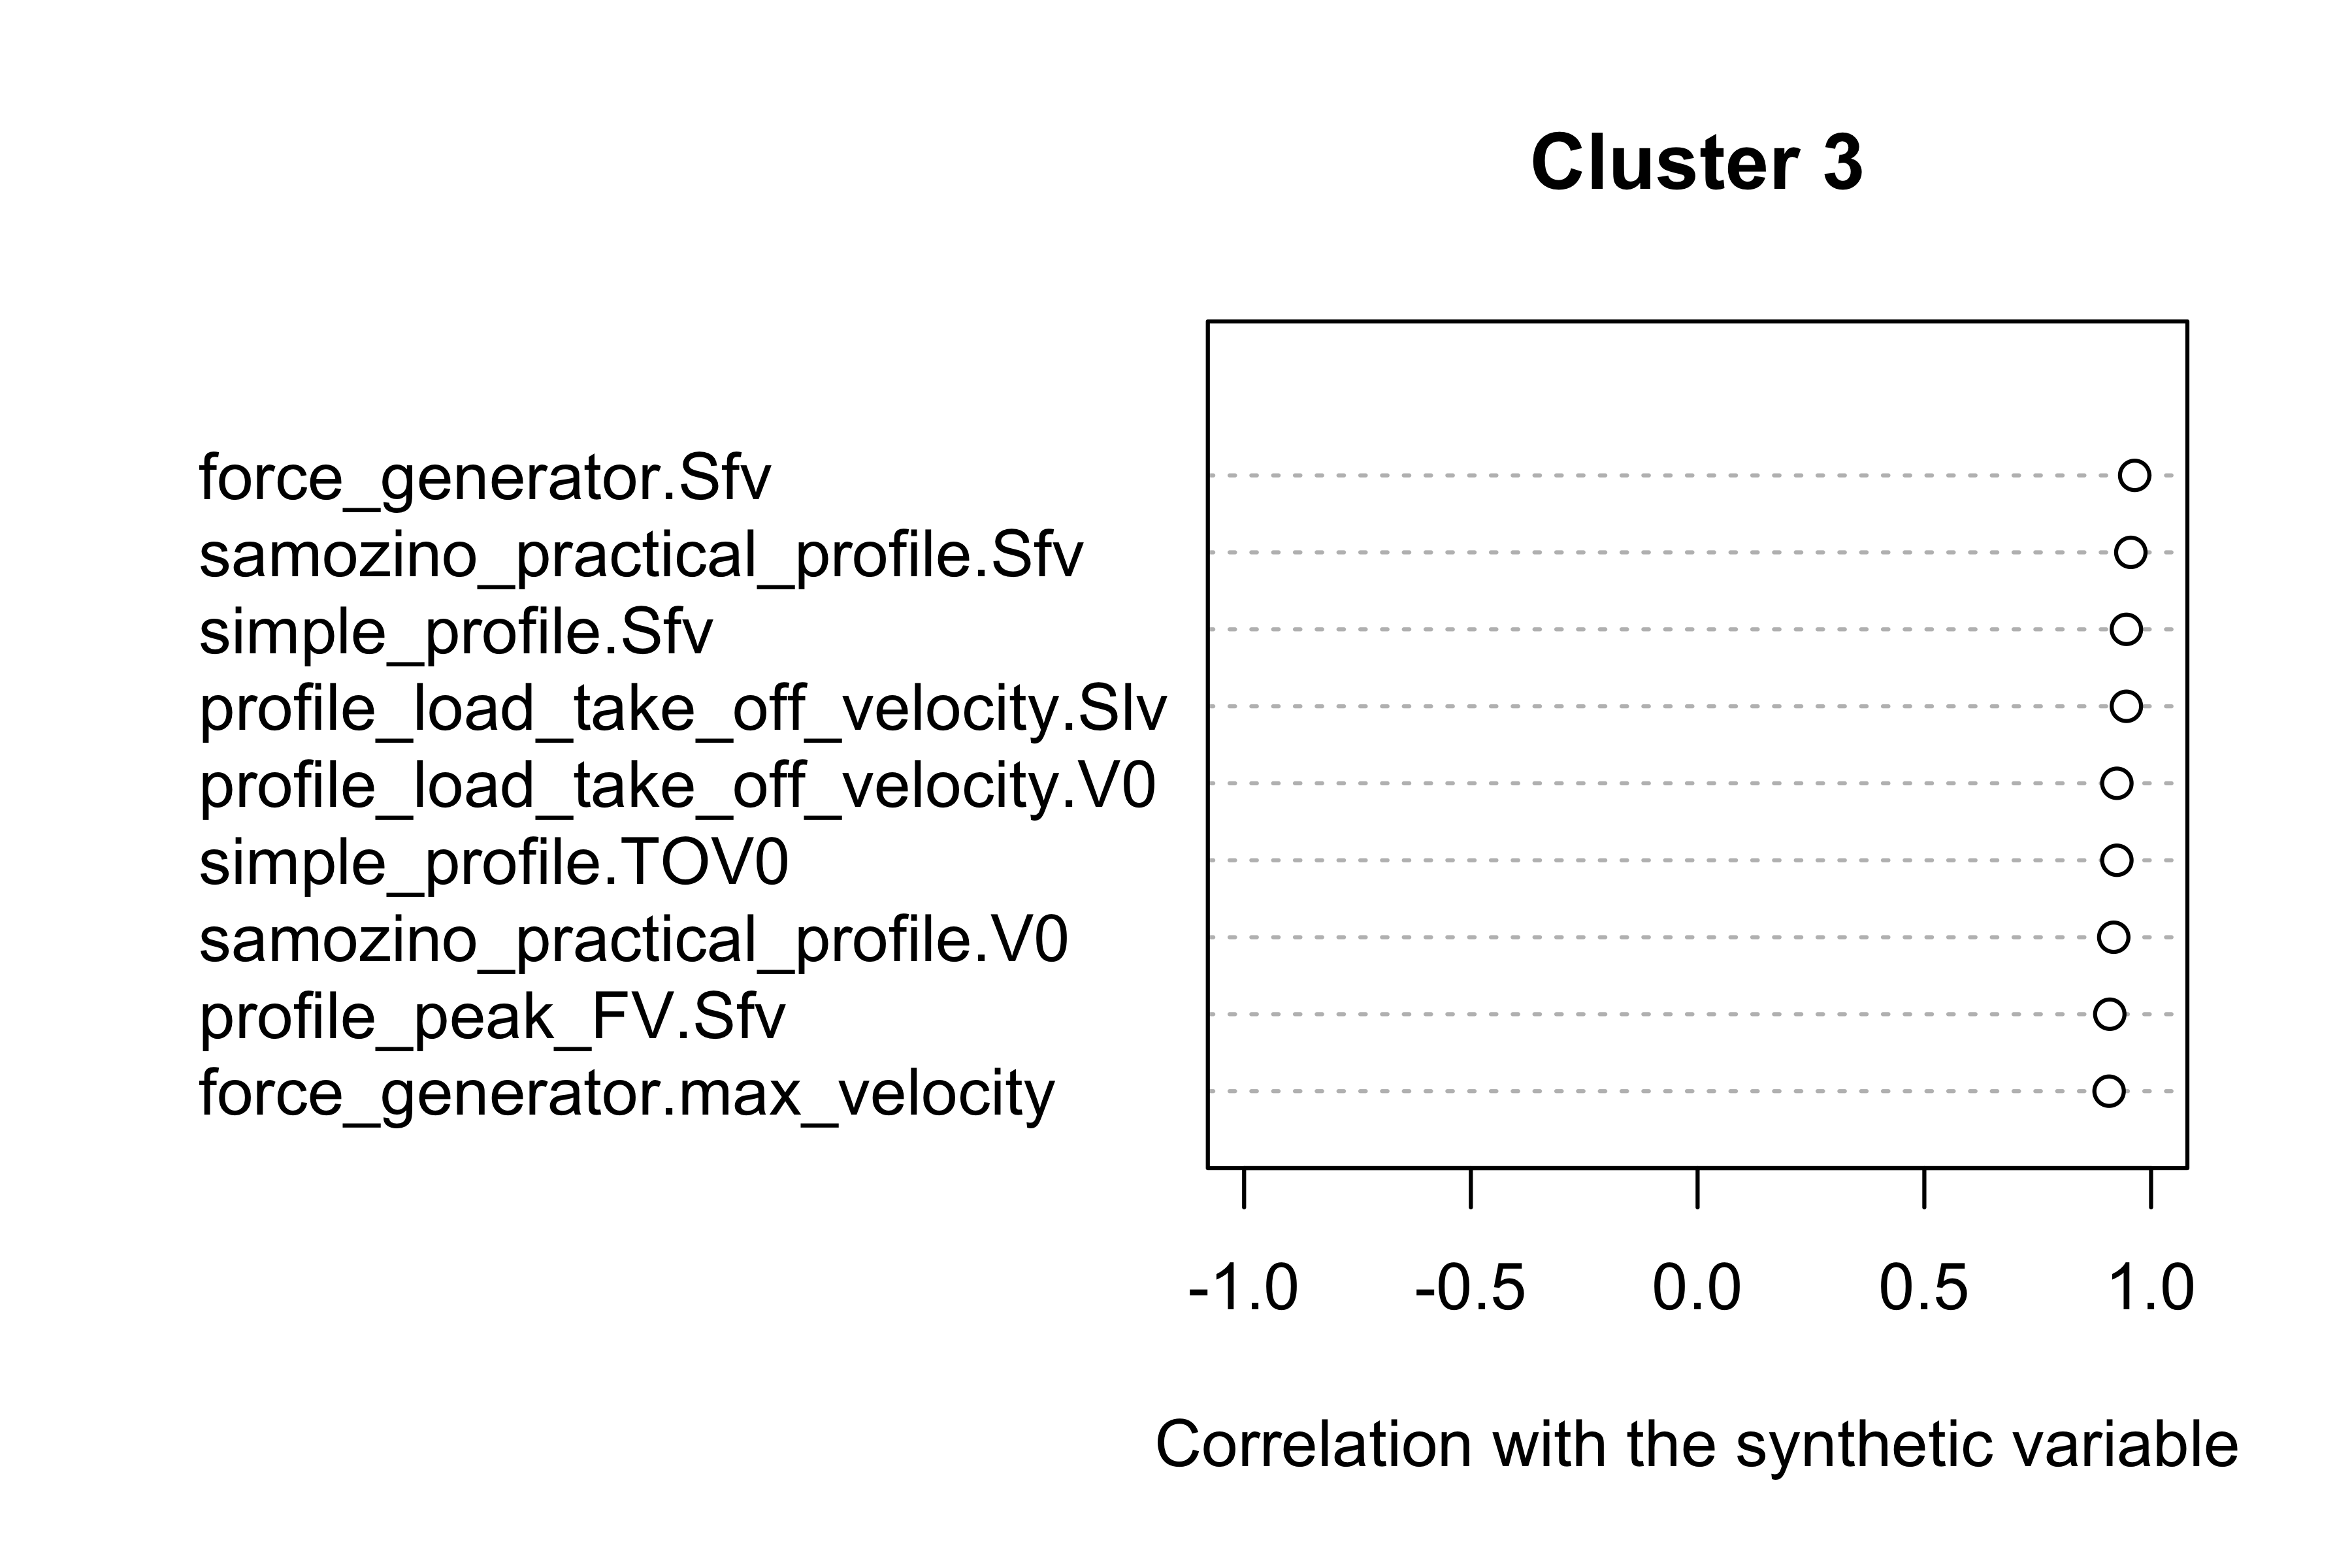
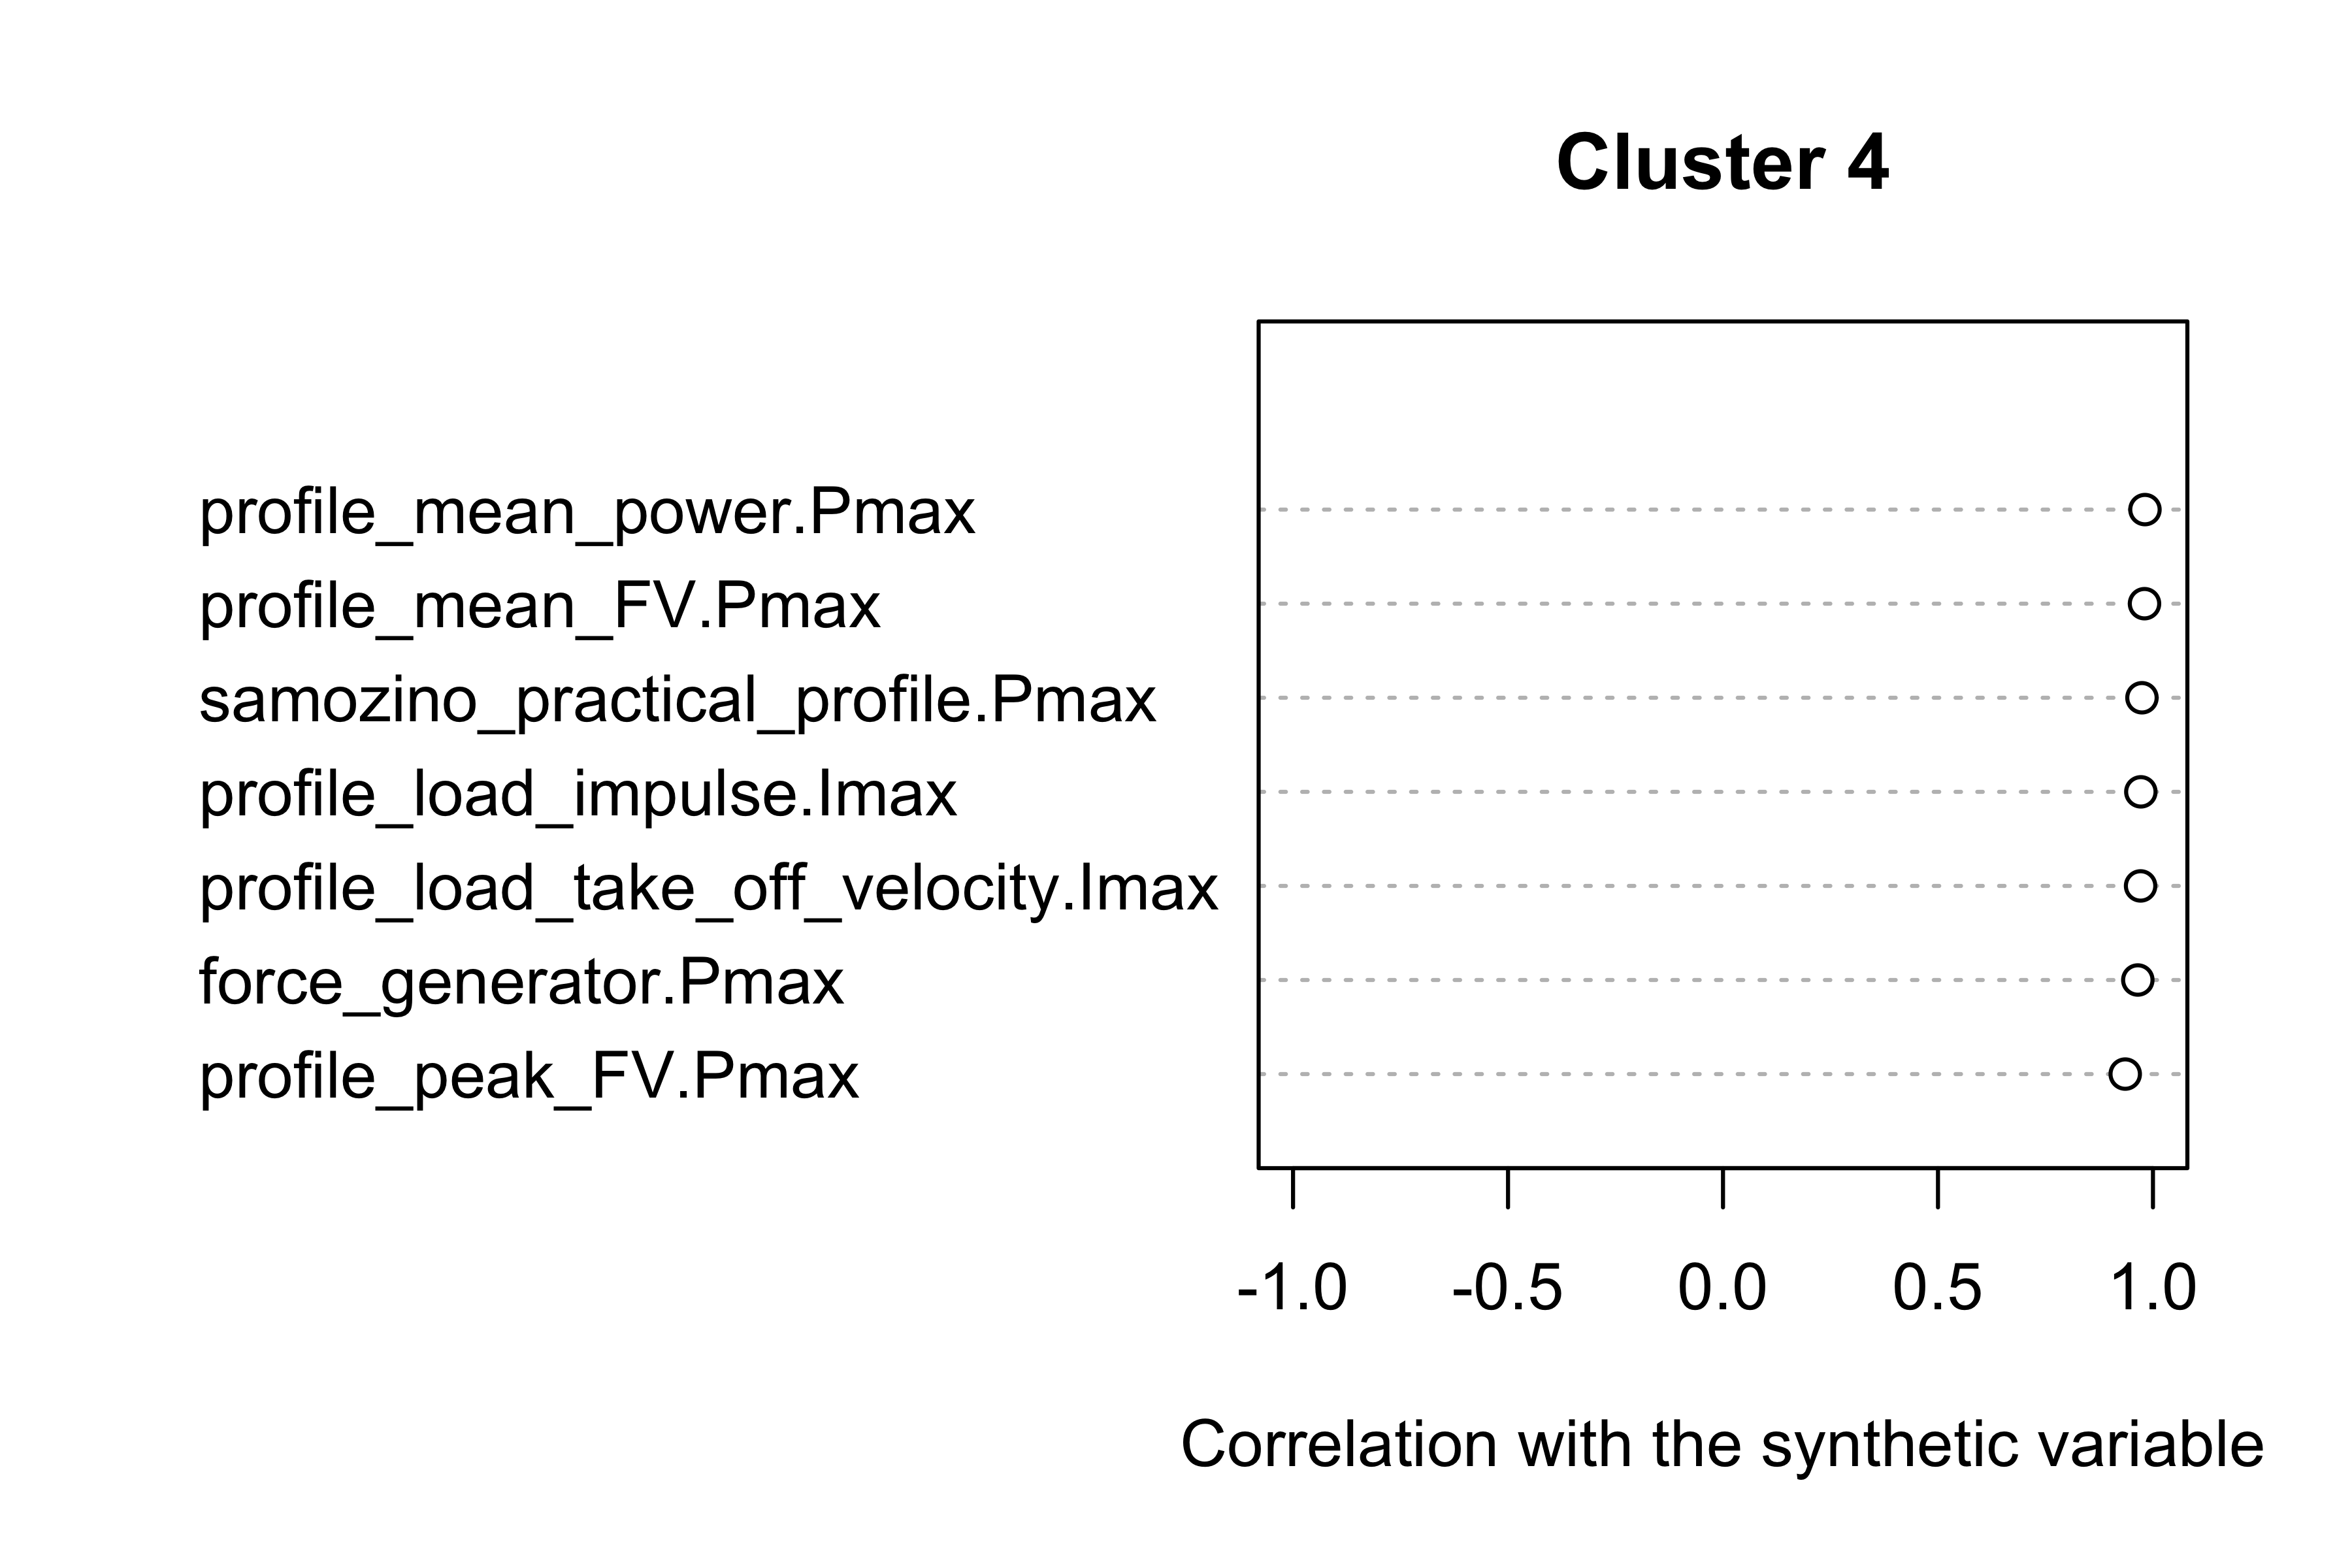
#> $coord.quanti
#> $coord.quanti$Cluster1
#>                                             dim 1
#> LPF_profile.slope                      -0.9350605
#> force_generator.time_to_max_activation -0.6992094
#> force_generator.decline_rate            0.1550889
#> force_generator.push_off_distance       0.2818969
#> profile_mean_FV.Sfv                     0.8661340
#> profile_peak_FV.V0                      0.8906017
#> profile_mean_FV.V0                      0.9438788
#>
#> $coord.quanti$Cluster2
#>                                       dim 1
#> force_generator.peak_location     0.0707664
#> profile_mean_FV.F0                0.9023549
#> profile_peak_FV.F0                0.9398599
#> force_generator.max_force         0.9767068
#> samozino_practical_profile.F0     0.9777222
#> profile_load_take_off_velocity.L0 0.9795751
#> simple_profile.L0                 0.9795751
#>
#> $coord.quanti$Cluster3
#>                                        dim 1
#> force_generator.max_velocity       0.9074145
#> profile_peak_FV.Sfv                0.9089502
#> samozino_practical_profile.V0      0.9176766
#> simple_profile.TOV0                0.9245467
#> profile_load_take_off_velocity.V0  0.9245467
#> profile_load_take_off_velocity.Slv 0.9455146
#> simple_profile.Sfv                 0.9455146
#> samozino_practical_profile.Sfv     0.9553041
#> force_generator.Sfv                0.9638523
#>
#> $coord.quanti$Cluster4
#>                                         dim 1
#> profile_peak_FV.Pmax                0.9354888
#> force_generator.Pmax                0.9647642
#> profile_load_take_off_velocity.Imax 0.9712058
#> profile_load_impulse.Imax           0.9717904
#> samozino_practical_profile.Pmax     0.9743840
#> profile_mean_FV.Pmax                0.9803157
#> profile_mean_power.Pmax             0.9813673
#>
#>
#> $coord.levels
#> $coord.levels$Cluster1
#> [1] "No categorical variables in this cluster"
#>
#> $coord.levels$Cluster2
#> [1] "No categorical variables in this cluster"
#>
#> $coord.levels$Cluster3
#> [1] "No categorical variables in this cluster"
#>
#> $coord.levels$Cluster4
#> [1] "No categorical variables in this cluster"
For the final variable cluster analysis, let’s use probing metrics and optimization profiles:
optimization_cluster <- var_clust(
  vjsim_data,
  c(
    # Probing characteristics
    "probe_bodyweight_jump.force_height_ratio",
    "probe_bodyweight_jump.velocity_height_ratio",
    "probe_bodyweight_jump.activation_height_ratio",
    "probe_bodyweight_jump.velocity_to_force_height_ratio",
    "probe_bodyweight_jump.velocity_to_activation_height_ratio",
    "probe_bodyweight_jump.force_to_activation_height_ratio",

    # Bosco index
    "bosco.index",

    # Profiles
    "LPF_profile.slope",
    "samozino_practical_profile.Sfv_perc",
    "samozino_practical_profile.probe_IMB",

    "simple_profile.Sfv_perc",
    "simple_profile.probe_IMB"
  )
)

optimization_cluster$graph

As can be seen from the above figure, Samozino optimization model \(S_{FV}\%\) and \(FV_{IMB}\) cluster very well with probe_bodyweight_jump.velocity_to_force_height_ratio. Interesting cluster is simple profile and Bosco Index cluster.
Intervention comments
So far, we have added some simulation evidence on the validity of the Samozino model to “predict” intervention effects on the FV curve. This is useful from a practical perspective, since as coaches we are interested in what quality needs to be developed to improve training effect. Samozino model allows some of those insights when it comes to squat jump. The procedure is simple (will walk you through the example data set in the modeling vignette): measure individual’s push-off distance, put him or her on the jump mat or something that can measure height and perform incremental jumps by adding extra weight (this is usually done with the barbell, but I prefer hex bar barbell, but again, the height of the barbell might be lower or higher than the distance at the bottom of the squat jump). Once we have these values, Samozino model can be performed and suggestions to what part of the FV curve to intervene. Unfortunately, Samozino model doesn’t tell us which effects are easier or less costly to get - it only tell us what would happen if the FV curve shifted. For example, if someone is weak as a kitten (has low \(F0\)), improving his force capabilities might be easier and thus more beneficial, even if the model suggest otherwise (i.e., improving \(V0\)).
So far there have been only two studies that attempted that (Jiménez-Reyes et al. 2017; Jiménez-Reyes, Samozino, and Morin 2019) with very interesting findings. I won’t go into detail of the studies, but the basic premise is simple: distribute individuals in personalized training based on their needs (identified by Samozino model) and see if vertical jump height improves better compared to well-balanced (or generic, mixed training).
Although I welcome this research I have few issues that I will cover here and finish with that. First issue is that groups were not blinded. This means that just by having a special training based on your needs might increase motivation and effects of training. These effects could be reduced by blinding the participants and researchers. Or estimated by adding someone on-purpose from the opposite optimization group (not to confirm the benefits, but to confirm the lack of benefits of personalized training, which is also important). For example, each optimization group (i.e. velocity group vs force group) has not only individuals that are identified as lacking those qualities, but a mix of everyone (but we lie to everyone that this is ideal scenario based on the model insights). For example, the velocity group has a mix of everyone, but we tell them it is their optimal group based on their needs. Then we analyze the sub-strata of the group.
Second issues is the change in training direction (variety) from a normal training, which can cause training effects by itself. Jimenez-Reyes et al. (Jiménez-Reyes et al. 2017; Jiménez-Reyes, Samozino, and Morin 2019) tried to control for this by having non-optimized group (which was similar to well-balanced group in terms of training content).
Third, and the most important issue is the message they are sending with realist ontology stance, that simple jump squat modeling represent an estimate of the whole lower body Force Generator, which implies that the whole training can be optimized based on the jump squat model. This might not be the intention of the authors, but readers are getting that impressions. Athlete not only need to jump from a static stance, but they needs to perform many other activities. If the whole training is optimized to make improvements in the jump squat, then maybe it might be much more under-optimized for other activities, or maybe even harmful. I have spent much more time and words on discussing the concepts of optimality vs. robustness in a pre-print paper and my books (Jovanović and Jukić 2019; Jovanović 2018, 2020c), so I direct you to those source.
I have started vjsim project since I failed to understand the math and logic behind Samozino model. This simulation allowed me to understand biomechanics of jumping a bit better and to appreciate the Samozino model application. I think it is useful model, but at the end of the day , it represents only one source of information for the coaches to consider and put under perspective and context. For example, Bosco Index and LPF slope might also give us some insight to which element someone needs to work (without a direct optimization objective). Overall, Samozino model represents a sound tool in your toolbox.
In the next vignette I will walk you through the analysis and modeling using the collected test data.
Shiny App
Now start playing with the code or with the Shiny App by click on the previous link or by running the following code:
vjsim::run_simulator()
The Shiny App will allow you much more interactive environment for exploring the vjsim.
References
Altmann, Thomas, Jakob Bodensteiner, Cord Dankers, Thommy Dassen, Nikolas Fritz, Sebastian Gruber, Philipp Kopper, Veronika Kronseder, Moritz Wagner, and Emanuel Renkl. 2019. Limitations of Interpretable Machine Learning Methods.
Borsboom, Denny. 2009. Measuring the Mind: Conceptual Issues in Modern Psychometrics. Cambridge: Cambridge University Press.
———. 2008. “Latent Variable Theory.” Measurement: Interdisciplinary Research & Perspective 6 (1-2): 25–53. https://doi.org/10.1080/15366360802035497.
Borsboom, Denny, Gideon J. Mellenbergh, and Jaap van Heerden. 2003. “The Theoretical Status of Latent Variables.” Psychological Review 110 (2): 203–19. https://doi.org/10.1037/0033-295X.110.2.203.
Chavent, Marie, Vanessa Kuentz, Benoit Liquet, and Jerome Saracco. 2017. ClustOfVar: Clustering of Variables. https://CRAN.R-project.org/package=ClustOfVar.
Goldstein, Alex, Adam Kapelner, Justin Bleich, and Emil Pitkin. 2013. “Peeking Inside the Black Box: Visualizing Statistical Learning with Plots of Individual Conditional Expectation.” arXiv:1309.6392 [Stat], September. http://arxiv.org/abs/1309.6392.
Greenwell, Brandon M. 2017. “Pdp: An R Package for Constructing Partial Dependence Plots.” The R Journal 9 (1): 421–36. https://doi.org/10.32614/RJ-2017-016.
Greenwell, Brandon M., Bradley C. Boehmke, and Andrew J. McCarthy. 2018. “A Simple and Effective Model-Based Variable Importance Measure.” arXiv:1805.04755 [Cs, Stat], May. http://arxiv.org/abs/1805.04755.
Jiménez-Reyes, Pedro, Pierre Samozino, Matt Brughelli, and Jean-Benoît Morin. 2017. “Effectiveness of an Individualized Training Based on Force-Velocity Profiling During Jumping.” Frontiers in Physiology 7 (January). https://doi.org/10.3389/fphys.2016.00677.
Jiménez-Reyes, Pedro, Pierre Samozino, and Jean-Benoît Morin. 2019. “Optimized Training for Jumping Performance Using the Force-Velocity Imbalance: Individual Adaptation Kinetics.” Edited by Daniel Boullosa. PLOS ONE 14 (5): e0216681. https://doi.org/10.1371/journal.pone.0216681.
Jovanović, Mladen. 2020a. Bmbstats: Bootstrap Magnitude-Based Statistics. https://github.com/mladenjovanovic/bmbstats.
———. 2020b. “Bmbstats: Magnitude-Based Statistics for Sports Scientists.” https://mladenjovanovic.github.io/bmbstats-book/. https://mladenjovanovic.github.io/bmbstats-book/.
———. 2018. HIIT Manual: High Intensity Interval Training and Agile Periodization. Ultimate Athlete Concepts.
———. 2019. “Statistical Modelling for Sports Scientists: Practical Introduction Using R (Part 1).” SportRxiv, September. https://doi.org/10.31236/osf.io/dnq3m.
———. 2020c. Strength Training Manual: The Agile Periodization Approach. Independently published.
Jovanović, Mladen, and Ivan Jukić. 2019. “Optimal Vs. Robust: Applications to Planning Strategies. Insights from a Simulation Study.” SportRxiv, April. https://doi.org/10.31236/osf.io/8n4jf.
Molnar, Christoph. 2018. Interpretable Machine Learning. Leanpub.
Samozino, P., P. Edouard, S. Sangnier, M. Brughelli, P. Gimenez, and J.-B. Morin. 2013. “Force-Velocity Profile: Imbalance Determination and Effect on Lower Limb Ballistic Performance.” International Journal of Sports Medicine 35 (06): 505–10. https://doi.org/10.1055/s-0033-1354382.
Samozino, Pierre. 2018a. “A Simple Method for Measuring Lower Limb Force, Velocity and Power Capabilities During Jumping.” In Biomechanics of Training and Testing, edited by Jean-Benoit Morin and Pierre Samozino, 65–96. Cham: Springer International Publishing. https://doi.org/10.1007/978-3-319-05633-3_4.
———. 2018b. “Optimal Force-Velocity Profile in Ballistic Push-Off: Measurement and Relationship with Performance.” In Biomechanics of Training and Testing, edited by Jean-Benoit Morin and Pierre Samozino, 97–119. Cham: Springer International Publishing. https://doi.org/10.1007/978-3-319-05633-3_5.
Samozino, Pierre, Jean-Benoît Morin, Frédérique Hintzy, and Alain Belli. 2008. “A Simple Method for Measuring Force, Velocity and Power Output During Squat Jump.” Journal of Biomechanics 41 (14): 2940–5. https://doi.org/10.1016/j.jbiomech.2008.07.028.
Samozino, Pierre, Jean-Benoît Morin, Frédérique Hintzy, and Alain Belli. 2010. “Jumping Ability: A Theoretical Integrative Approach.” Journal of Theoretical Biology 264 (1): 11–18. https://doi.org/10.1016/j.jtbi.2010.01.021.
Samozino, Pierre, Enrico Rejc, Pietro Enrico Di Prampero, Alain Belli, and Jean-Benoît Morin. 2012. “Optimal Force–Velocity Profile in Ballistic Movements—Altius: Citius or Fortius?” Medicine & Science in Sports & Exercise 44 (2): 313–22. https://doi.org/10.1249/MSS.0b013e31822d757a.