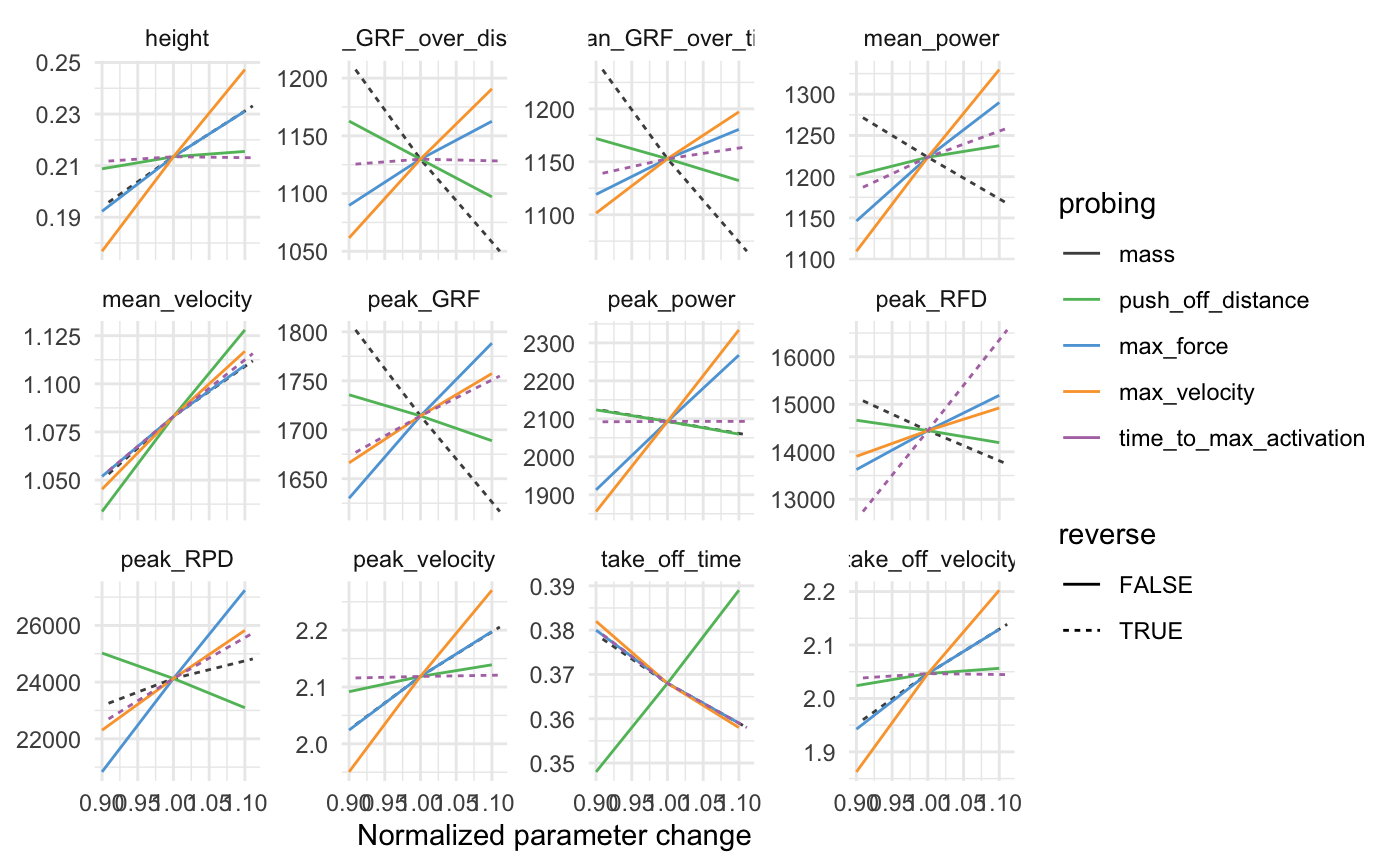
probe_vj simulates the vertical jump, but estimate which parameter brings biggest change. This is done
by keeping all parameters at initial value, while changing only one parameter. This is then repeated for
all parameters. This way we can answer by changing what parameter for standardize change (change_ratio)
yield biggest change in summary metric (e.g. jump height)
probe_vj(
  mass = 75,
  push_off_distance = 0.4,
  max_force = 3000,
  max_velocity = 4,
  time_to_max_activation = 0.3,
  change_ratio = seq(0.9, 1.1, length.out = 3),
  aggregate = "raw",
  ...
)
Arguments
| mass | Numeric value. Initial parameter value to be changed using |
|---|---|
| push_off_distance | Numeric value. Initial parameter value to be changed using |
| max_force | Numeric value. Initial parameter value to be changed using |
| max_velocity | Numeric value. Initial parameter value to be changed using |
| time_to_max_activation | Numeric value. Initial parameter value to be changed using |
| change_ratio | Numeric vector indicating probing change ratios |
| aggregate | How should |
| ... | Extra argument forwarded to |
Value
Probing data frame
Examples
require(tidyverse)

vj_probe_data <- probe_vj(
  mass = 75,
  max_force = 3000,
  max_velocity = 3,
  time_to_max_activation = 0.3,
  time_step = 0.001
)

# Invert for mass and time_to_max_activation
vj_probe_data$change_ratio <- ifelse(
  vj_probe_data$probing == "time_to_max_activation",
  1 / vj_probe_data$change_ratio,
  vj_probe_data$change_ratio
)

vj_probe_data$change_ratio <- ifelse(
  vj_probe_data$probing == "mass",
  1 / vj_probe_data$change_ratio,
  vj_probe_data$change_ratio
)


plot_data <- gather(vj_probe_data, key = "variable", value = "value", -(1:9)) %>%
  filter(variable %in% c(
    "height",
    "take_off_time",
    "mean_velocity",
    "peak_velocity",
    "take_off_velocity",
    "mean_GRF_over_distance",
    "mean_GRF_over_time",
    "peak_GRF",
    "peak_power",
    "mean_power",
    "peak_RFD",
    "peak_RPD"
  ))

plot_data$reverse <- plot_data$probing %in% c("mass", "time_to_max_activation")

ggplot(plot_data, aes(x = change_ratio, y = value, color = probing, linetype = reverse)) +
  theme_minimal() +
  geom_line() +
  facet_wrap(~variable, scales = "free_y") +
  xlab("Normalized parameter change") +
  ylab(NULL) +
  scale_color_manual(values = c(
    "mass" = "#4D4D4D",
    "max_force" = "#5DA5DA",
    "max_velocity" =  "#FAA43A",
    "push_off_distance" = "#60BD68",
    "time_to_max_activation" = "#B276B2"
  ))