Functions for creating ggplot2 plot of the Set and Reps Scheme
Examples
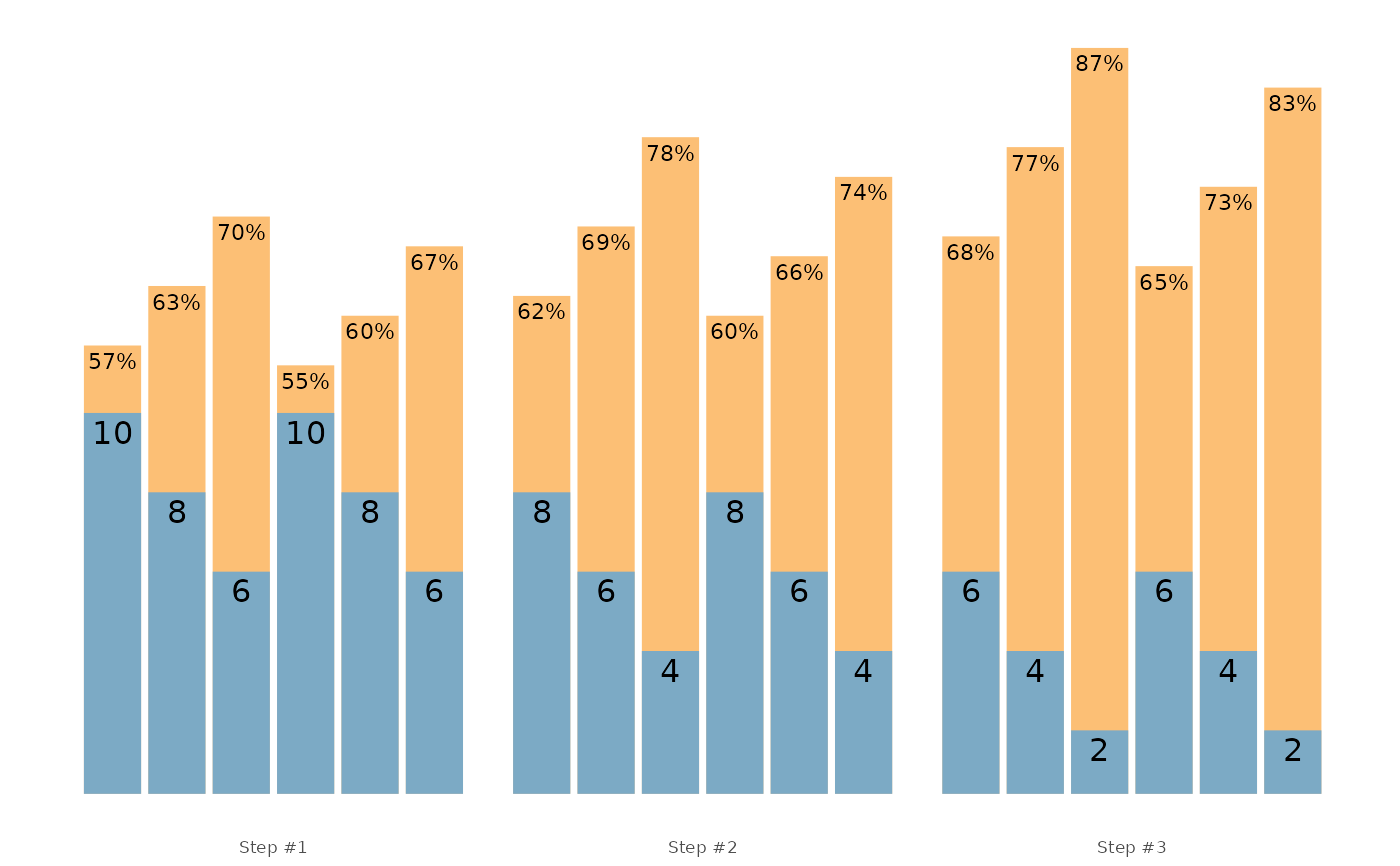
scheme <- scheme_wave(
  reps = c(10, 8, 6, 10, 8, 6),
  # Adjusting sets to use lower %1RM (RIR Inc method used, so RIR adjusted)
  adjustment = c(4, 2, 0, 6, 4, 2),
  vertical_planning = vertical_linear,
  vertical_planning_control = list(reps_change = c(0, -2, -4)),
  progression_table = progression_RIR_increment,
  progression_table_control = list(volume = "extensive")
)

plot_scheme(scheme)
#> Warning: `plot_scheme()` is deprecated as of STMr 0.1.4. Please use S3 `plot()` method instead.