S3 method for plotting model
# S3 method for dorem
plot(x, type = "pred", ...)
Arguments
| x | Object of class |
|---|---|
| type | Type of plot. Options are "pred", "coef", "perf", which "pred" being default |
| ... | Extra arguments |
Examples
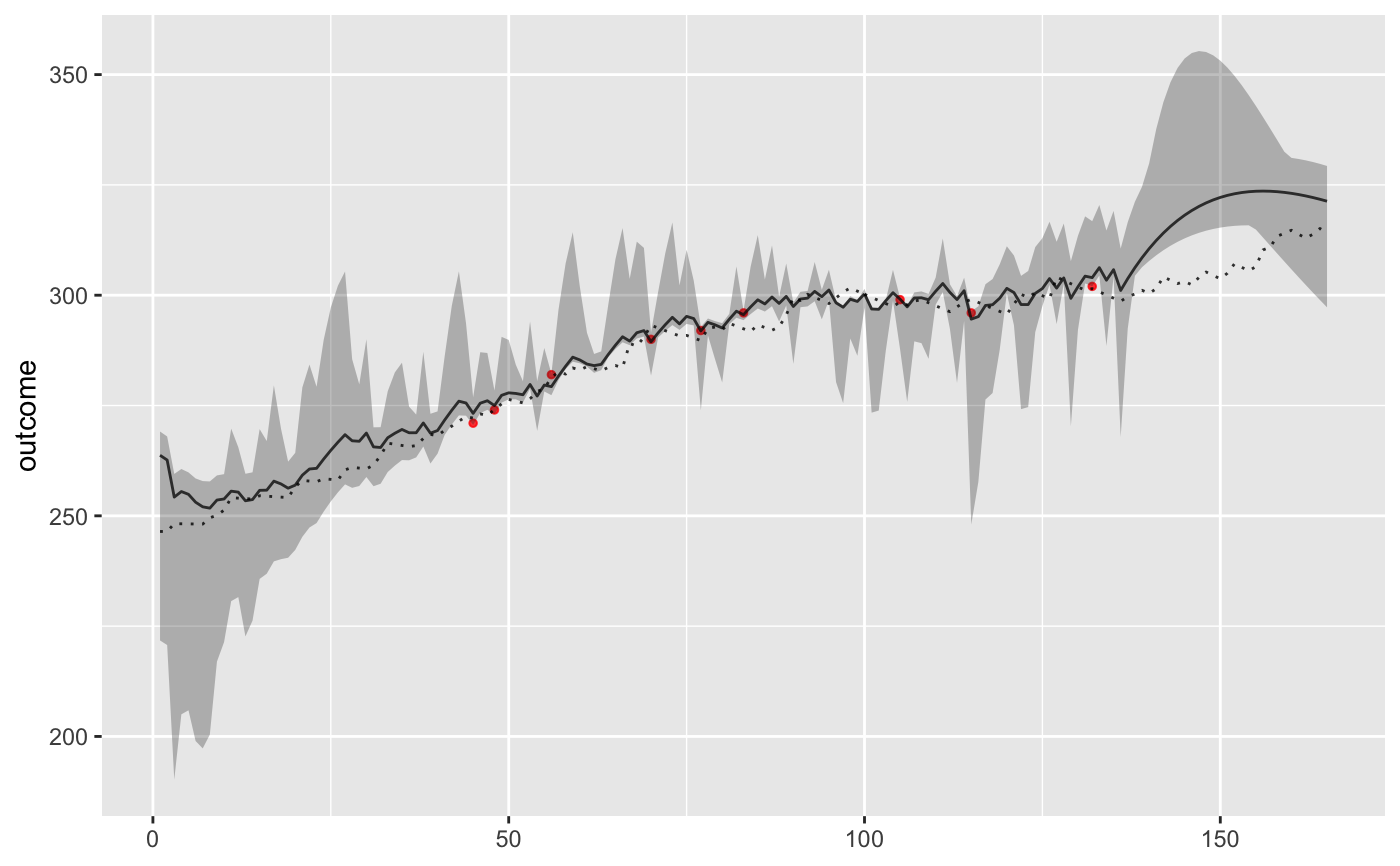
data("bike_score") banister_model <- dorem( Test_5min_Power ~ BikeScore, bike_score, method = "banister", control = dorem_control( cv_folds = 3, cv_repeats = 5, shuffle = TRUE ) )#>#>#>#>#>#>#>#>#>#>#>#>#>#>#>#>#>#>#>#>plot(banister_model)#> Warning: Removed 156 rows containing missing values (geom_point).