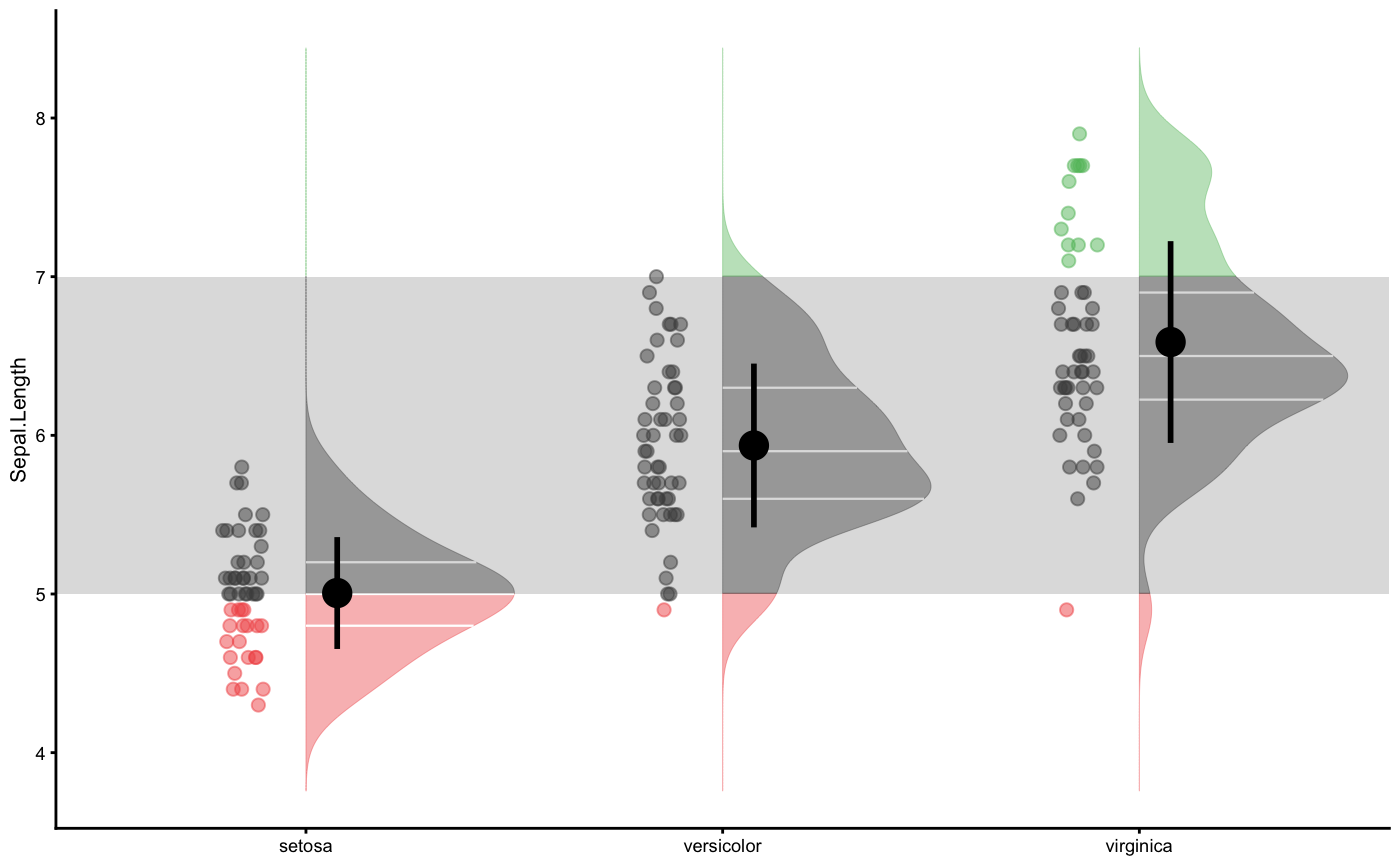
Raincloud plot with smallest effect size of interest
Source:R/plot-raincloud.R
plot_raincloud_SESOI.RdRaincloud plot with smallest effect size of interest
plot_raincloud_SESOI(
  data,
  value,
  value_label = value,
  groups = NULL,
  SESOI_lower = 0,
  SESOI_upper = 0,
  control = plot_control()
)
Arguments
| data | Data frame |
|---|---|
| value | Character string. Name of the column in |
| value_label | Character string. Label to be used. Default is |
| groups | Character string. Name of the column in |
| SESOI_lower | Lower smallest effect size of interest threshold |
| SESOI_upper | Upper smallest effect size of interest threshold |
| control | Plotting control object returned from |
Value
ggplot object
See also
Examples
plot_raincloud_SESOI( iris, value = "Sepal.Length", groups = "Species", SESOI_lower = 5, SESOI_upper = 7 )#>