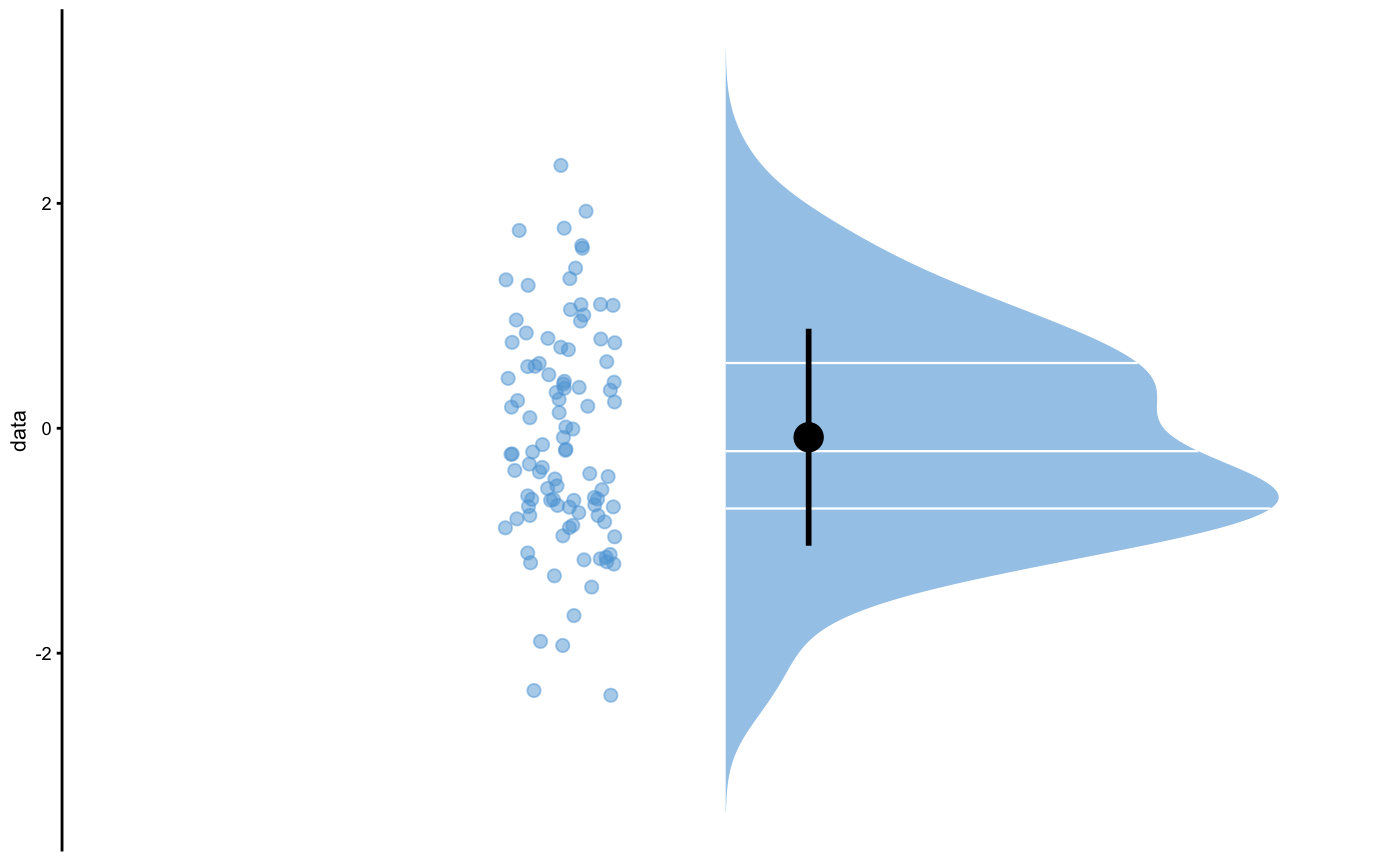
Raincloud plot
plot_raincloud(
  data,
  value,
  value_label = value,
  groups = NULL,
  control = plot_control()
)
Arguments
| data | Data frame |
|---|---|
| value | Character string. Name of the column in |
| value_label | Character string. Label to be used. Default is |
| groups | Character string. Name of the column in |
| control | Plotting control object returned from |
Value
ggplot object
See also
Examples
#>plot_raincloud( iris, value = "Sepal.Length", groups = "Species", control = plot_control(points_size = 1) )#>