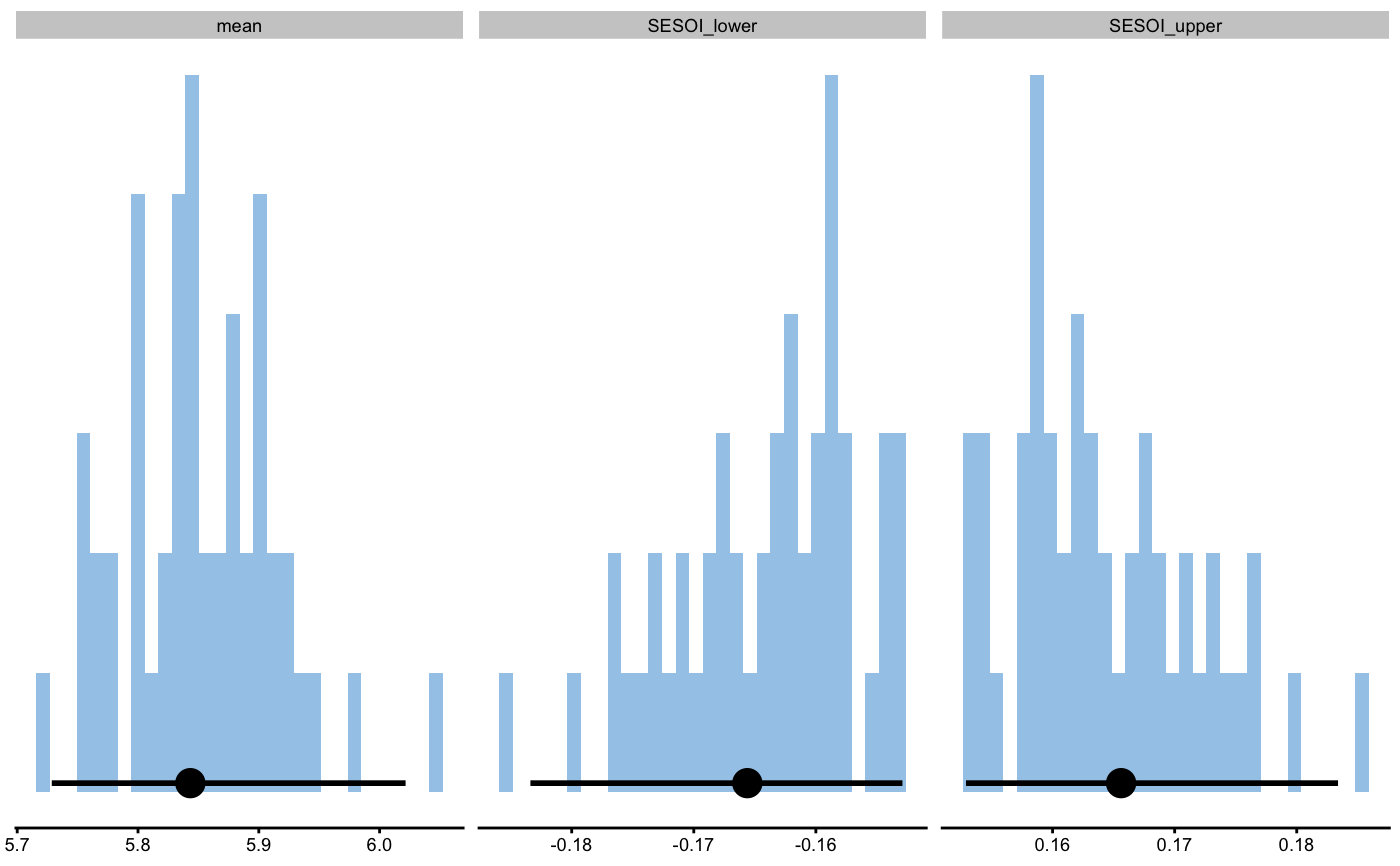
This function plots the bootstrap distribution
# S3 method for bmbstats
plot(x, ...)
Arguments
| x | Object of class |
|---|---|
| ... | Extra arguments. Use |
Examples
x <- bmbstats(iris, SESOI_lower_function = function(data, na.rm, init_boot) { sd(data$Sepal.Length) * -0.2 }, SESOI_upper_function = function(data, na.rm, init_boot) { sd(data$Sepal.Length) * 0.2 }, estimator_function = function(data, SESOI_lower, SESOI_upper, na.rm, init_boot) { list(mean = mean(data$Sepal.Length), SESOI_lower = SESOI_lower, SESOI_upper = SESOI_upper) }, control = model_control(boot_type = "perc", boot_samples = 50) )#>#>#>plot(x)