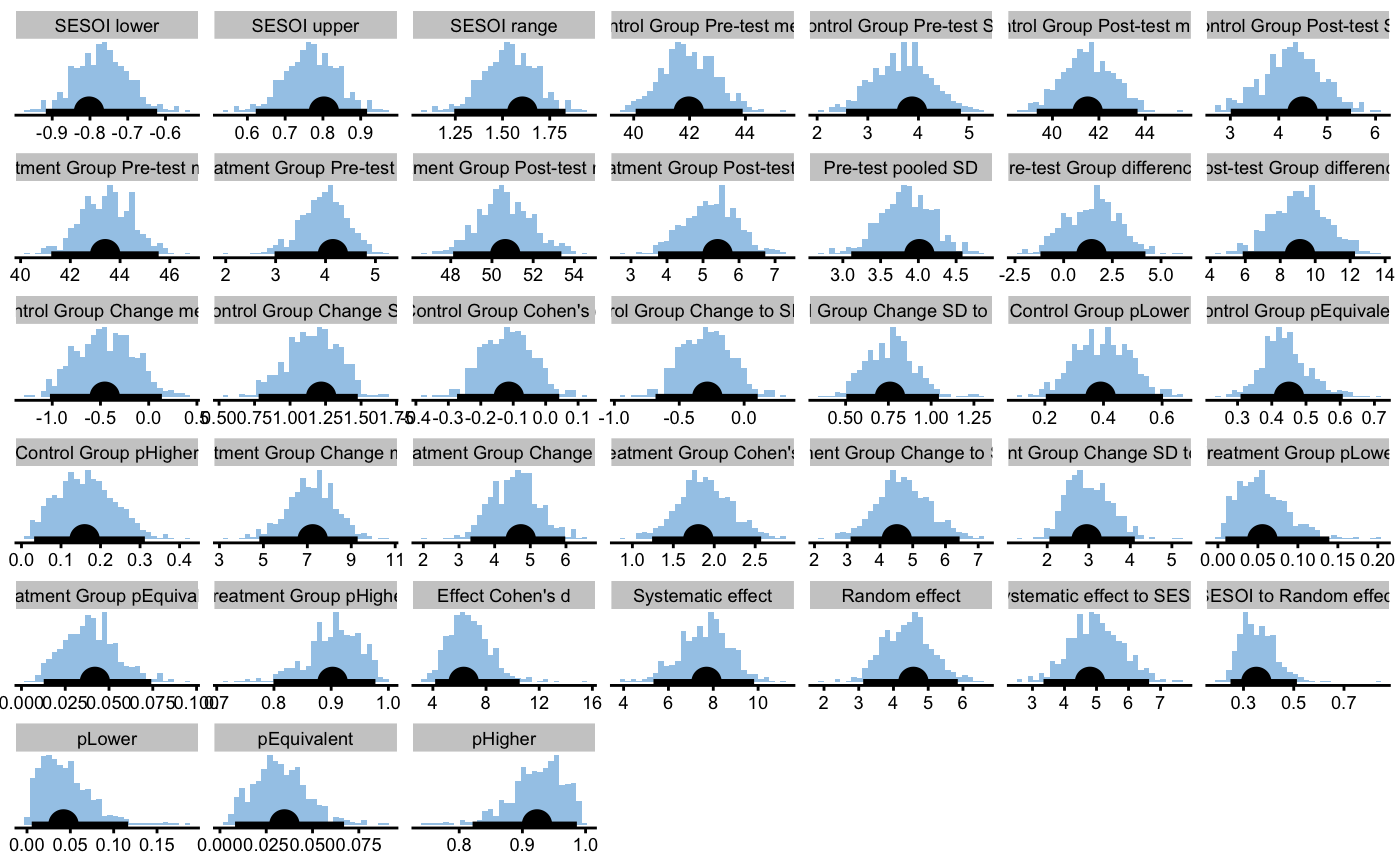
Wrapper function for bmbstats function to provide modular analysis for the Randomized Controlled Trials
RCT_analysis(
  data,
  group,
  treatment_label,
  control_label,
  pre_test,
  post_test,
  SESOI_lower = SESOI_lower_RCT_func,
  SESOI_upper = SESOI_upper_RCT_func,
  estimator_function = RCT_estimators,
  control = model_control(),
  na.rm = FALSE
)
Arguments
| data | Data frame |
|---|---|
| group | Character vector indicating the name of the column in |
| treatment_label | Character vector indicating the label inside the |
| control_label | Character vector indicating the label inside the |
| pre_test | Character vector indicating the name of the column in |
| post_test | Character vector indicating the name of the column in |
| SESOI_lower | Function or numeric scalar. Default is |
| SESOI_upper | Function or numeric scalar. Default is |
| estimator_function | Function for providing RCT estimators. Default is |
| control | Control object returned from |
| na.rm | Should NAs be removed? Default is |
Value
Object of class bmbstats_RCT_analysis
Examples
set.seed(1666) data("vertical_jump_data") rct_model <- RCT_analysis( vertical_jump_data, group = "Group", treatment_label = "Treatment", control_label = "Control", pre_test = "Pre-test", post_test = "Post-test", control = model_control(boot_type = "perc", boot_samples = 500) )#>#>#>rct_model#> Bootstrap with 500 resamples and 95% perc confidence intervals. #> #> estimator value lower upper #> SESOI lower -0.80259313 -0.916937793 -0.62217424 #> SESOI upper 0.80259313 0.622174241 0.91693779 #> SESOI range 1.60518625 1.244348481 1.83387559 #> Control Group Pre-test mean 41.97201858 40.070726393 43.89983516 #> Control Group Pre-test SD 3.87342737 2.571005252 4.83773470 #> Control Group Post-test mean 41.51639922 39.323466781 43.66490461 #> Control Group Post-test SD 4.49231955 3.008126445 5.49275343 #> Treatment Group Pre-test mean 43.40125919 41.231916433 45.55214419 #> Treatment Group Pre-test SD 4.14781229 2.978642673 4.82792917 #> Treatment Group Post-test mean 50.64446956 48.115227975 53.36833663 #> Treatment Group Post-test SD 5.40368932 3.751098419 6.72807739 #> Pre-test pooled SD 4.01296563 3.110871204 4.58468896 #> Pre-test Group difference 1.42924061 -1.192567797 4.19999753 #> Post-test Group difference 9.12807035 5.851510302 12.27758690 #> Control Group Change mean -0.45561936 -1.023920353 0.13681690 #> Control Group Change SD 1.21897409 0.778854389 1.47690522 #> Control Group Cohen's d -0.11353682 -0.273173147 0.04182324 #> Control Group Change to SESOI -0.28384205 -0.682932866 0.10455809 #> Control Group Change SD to SESOI 0.75939729 0.503988237 1.04560122 #> Control Group pLower 0.39004196 0.203215264 0.60306946 #> Control Group pEquivalent 0.45021515 0.308693577 0.60752217 #> Control Group pHigher 0.15974290 0.032023990 0.31217505 #> Treatment Group Change mean 7.24321037 4.812594389 9.29185965 #> Treatment Group Change SD 4.73312041 3.319830588 5.97975267 #> Treatment Group Cohen's d 1.80495201 1.240621946 2.57302225 #> Treatment Group Change to SESOI 4.51238001 3.101554865 6.43255564 #> Treatment Group Change SD to SESOI 2.94864250 2.052853512 4.10793394 #> Treatment Group pLower 0.05562494 0.009334664 0.13932903 #> Treatment Group pEquivalent 0.04192299 0.012709630 0.07413350 #> Treatment Group pHigher 0.90245207 0.799126871 0.97733335 #> Effect Cohen's d 6.31582723 4.170220414 10.53320324 #> Systematic effect 7.69882973 5.332467536 9.82192017 #> Random effect 4.57345941 3.127782107 5.85186532 #> Systematic effect to SESOI 4.79622207 3.343847886 6.64262037 #> SESOI to Random effect 0.35097857 0.248332215 0.51264007 #> pLower 0.04209719 0.005460745 0.11671585 #> pEquivalent 0.03481090 0.008148954 0.06702807 #> pHigher 0.92309191 0.821121165 0.98621774plot(rct_model)
