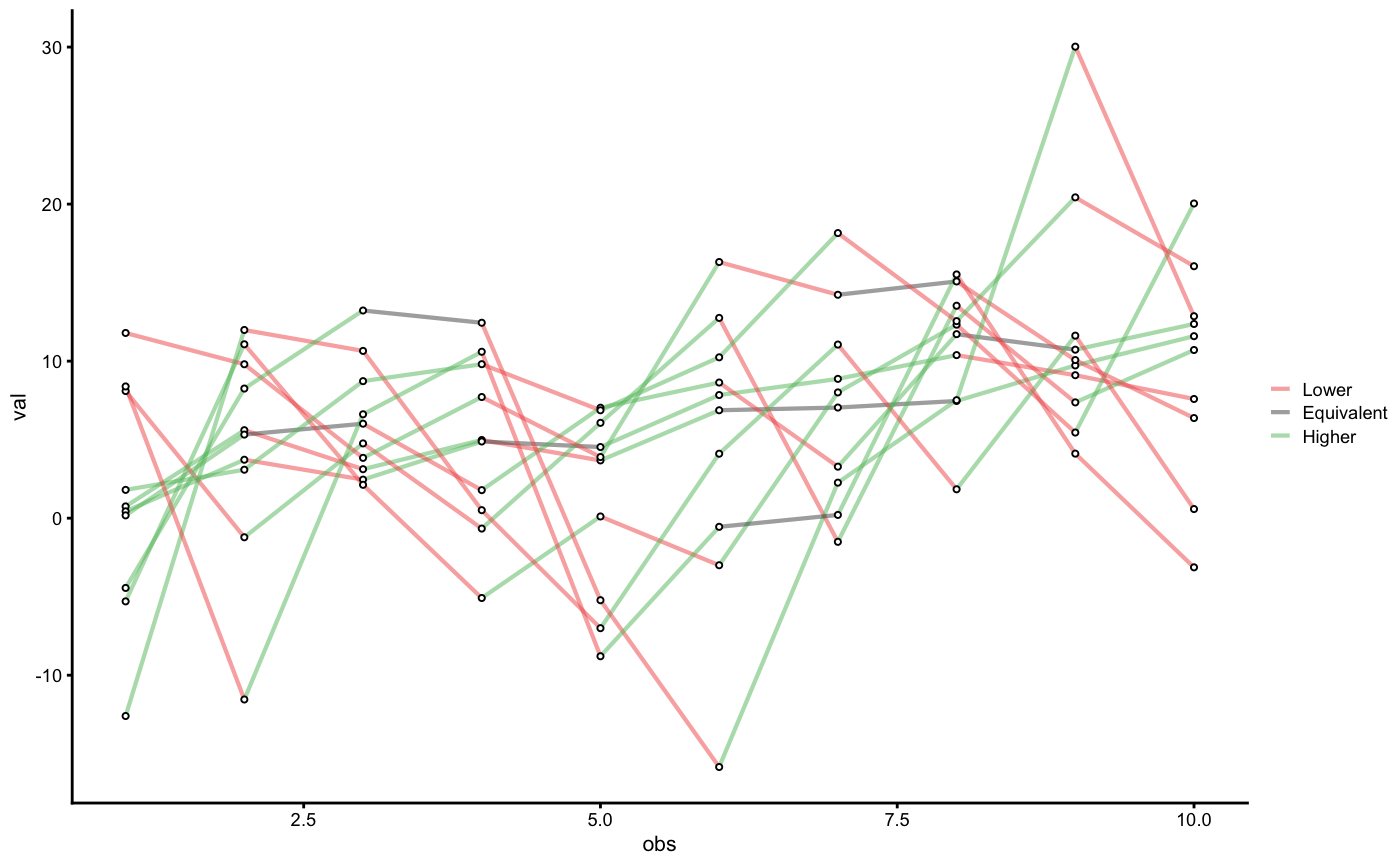
Spaghetti plot
plot_spaghetti(
  data,
  id,
  observations,
  observations_label = observations,
  value,
  value_label = value,
  SESOI_lower = 0,
  SESOI_upper = 0,
  control = plot_control()
)
Arguments
| data | Data frame |
|---|---|
| id | Character string. Name of the column in |
| observations | Character string. Name of the column in |
| observations_label | Character string. Label to be used for x-axis. Default is |
| value | Character string. Name of the column in |
| value_label | Character string. Label to be used. Default is |
| SESOI_lower | Lower smallest effect size of interest threshold |
| SESOI_upper | Upper smallest effect size of interest threshold |
| control | Plotting control object returned from |
Value
ggplot object
Examples
test_data <- expand.grid(
  id = 1:10,
  obs = 1:10
)

test_data$val <- with(
  test_data,
  rnorm(nrow(test_data), obs, id)
)

plot_spaghetti(
  test_data,
  id = "id",
  observations = "obs",
  value = "val",
  SESOI_lower = -1,
  SESOI_upper = 1,
  control = plot_control(
    points_shape = 21,
    points_fill = "white",
    points_alpha = 1,
    points_size = 0.75,
    line_size = 0.75,
    legend_position = "right"
  )
)