This function is used in reliability and validity visualization
plot_pair_lm(
  predictor,
  outcome,
  SESOI_lower = 0,
  SESOI_upper = 0,
  confidence = 0.95,
  predictor_label = "Predictor",
  outcome_label = "Outcome",
  fitted_label = "Fitted",
  residuals_label = "Residuals",
  control = plot_control(),
  na.rm = FALSE
)
Arguments
| predictor | Numeric vector |
|---|---|
| outcome | Vector |
| SESOI_lower | Lower smallest effect size of interest threshold |
| SESOI_upper | Upper smallest effect size of interest threshold |
| confidence | Default is 0.95 |
| predictor_label | Character vector. The name of the |
| outcome_label | Character vector. The name of the |
| fitted_label | Character vector. The label to be used for fitted. Default is "Fitted" |
| residuals_label | Character vector. The label to be used for residuals. Default is "Residuals" |
| control | Plotting control object returned from |
| na.rm | Should NAs be removed? Default is |
Value
ggplot object
See also
plot_pair_BA for Bland-Altman plot and
plot_pair_OLP for ordinary-least-squares residuals
plot
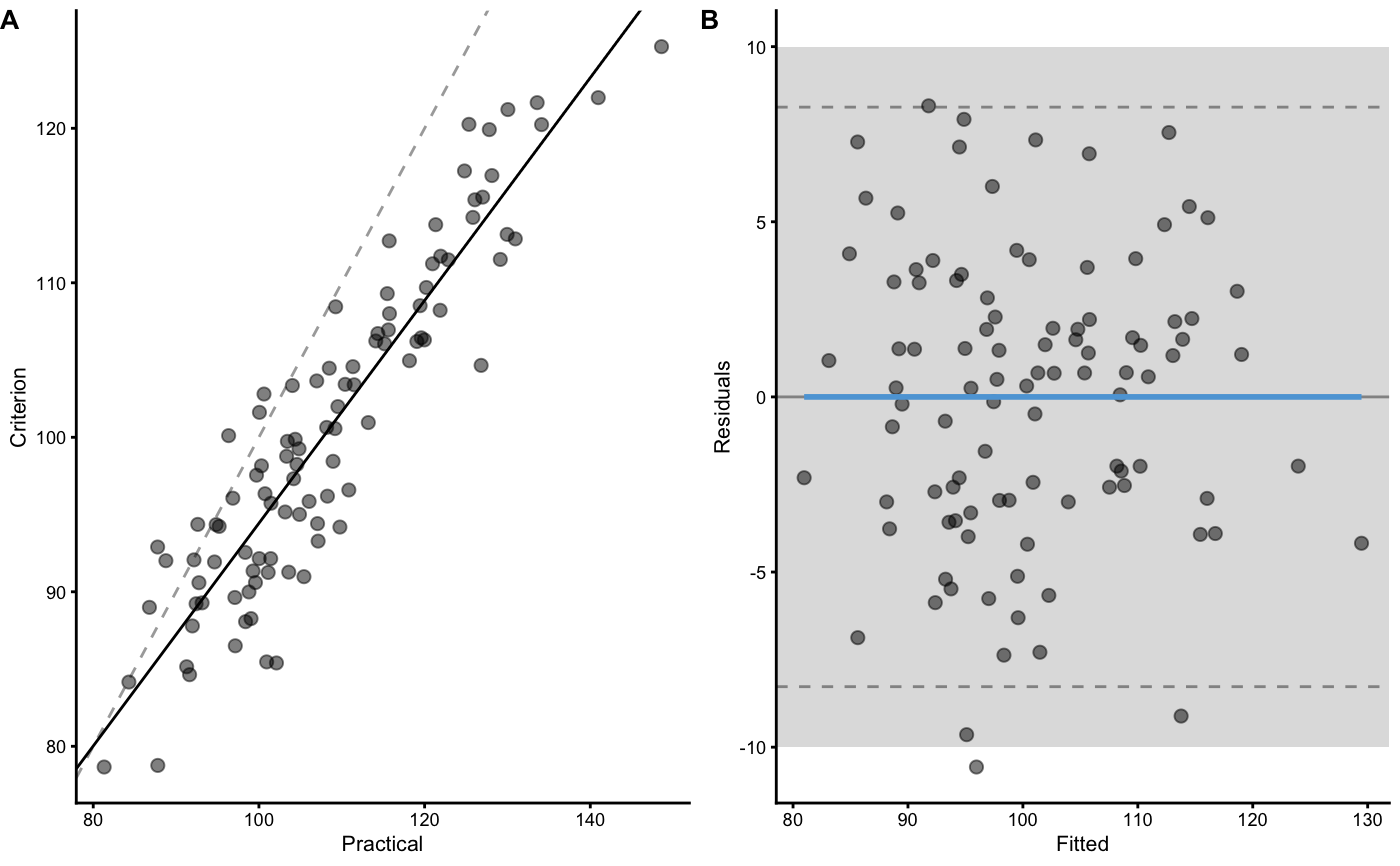
Examples
criterion <- rnorm(
  n = 100,
  mean = 100,
  sd = 10
)

practical <- criterion * 1.2 + rnorm(n = 100, mean = -12, sd = 5)

plot_pair_lm(practical,
  criterion,
  SESOI_lower = -10,
  SESOI_upper = 10,
  predictor_label = "Practical",
  outcome_label = "Criterion"
)