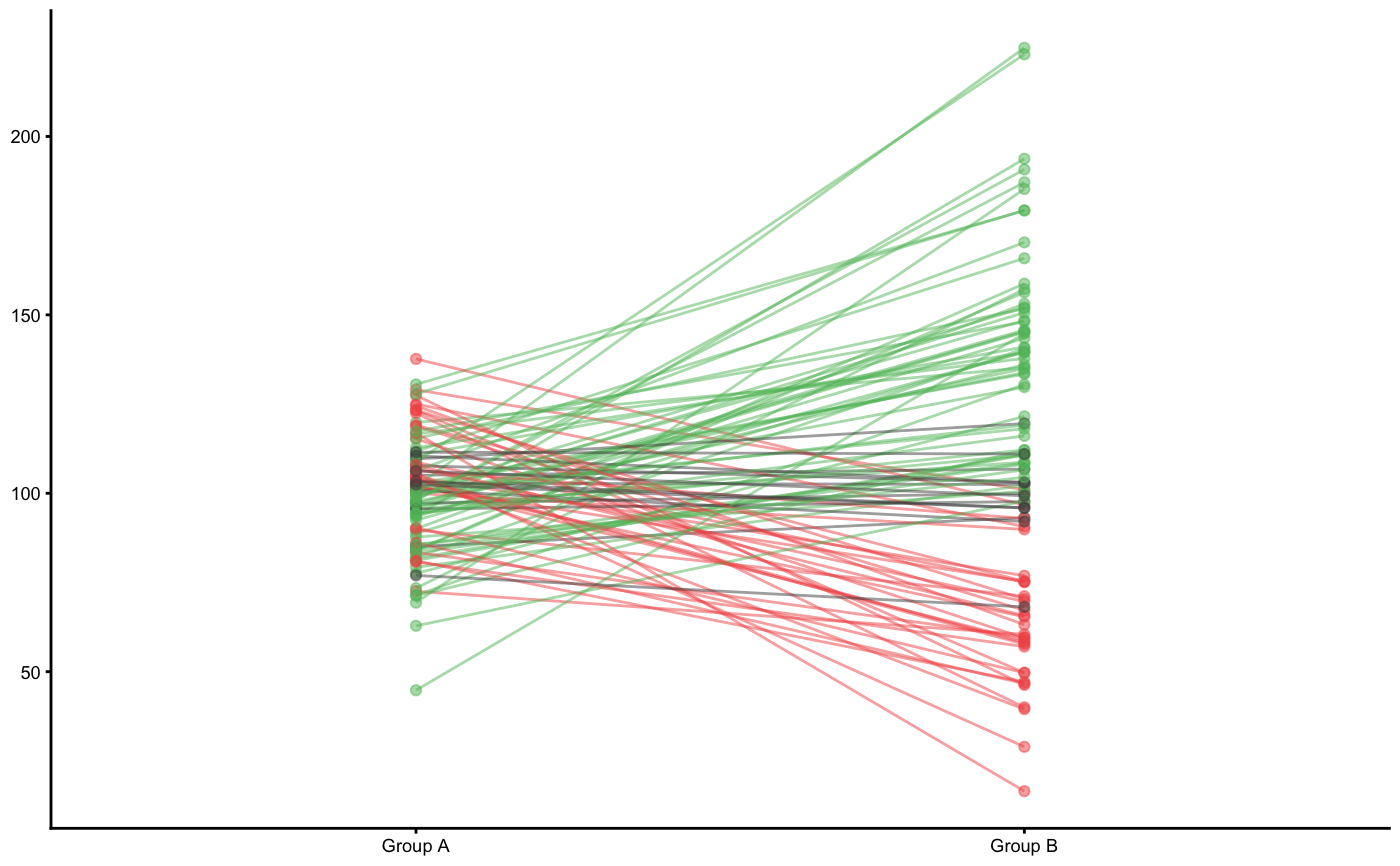
Plot pair changes
plot_pair_changes(
  group_a,
  group_b,
  value_label = NULL,
  group_label = NULL,
  SESOI_lower = 0,
  SESOI_upper = 0,
  group_a_label = "Group A",
  group_b_label = "Group B",
  control = plot_control()
)
Arguments
| group_a | Numeric vector. This group represents baseline/control, observed variable, Pre-test in the paired design, or "practical" measure |
|---|---|
| group_b | Numeric vector. This group represents experimental, predicted variable, Post-test in the paired design, or "criterion" measure |
| value_label | Character string. Label to be used for y-axis. Default is |
| group_label | Character string. Label to be used for x-axis. Default is |
| SESOI_lower | Lower smallest effect size of interest threshold |
| SESOI_upper | Upper smallest effect size of interest threshold |
| group_a_label | Character vector. The name of the |
| group_b_label | Character vector. The name of the |
| control | Plotting control object returned from |
Value
Returns link[ggplot2]{ggplot} object