S3 method for plotting bootstrap_MET results
# S3 method for bmbstats_MET
plot(x, type = "CI", ...)
Arguments
| x | Object of class |
|---|---|
| type | What test to plot? Options are "inferiority", "non-superiority", "equivalence", "non-inferiority", "superiority", "CI". Default is "CI" |
| ... | Extra arguments. Use |
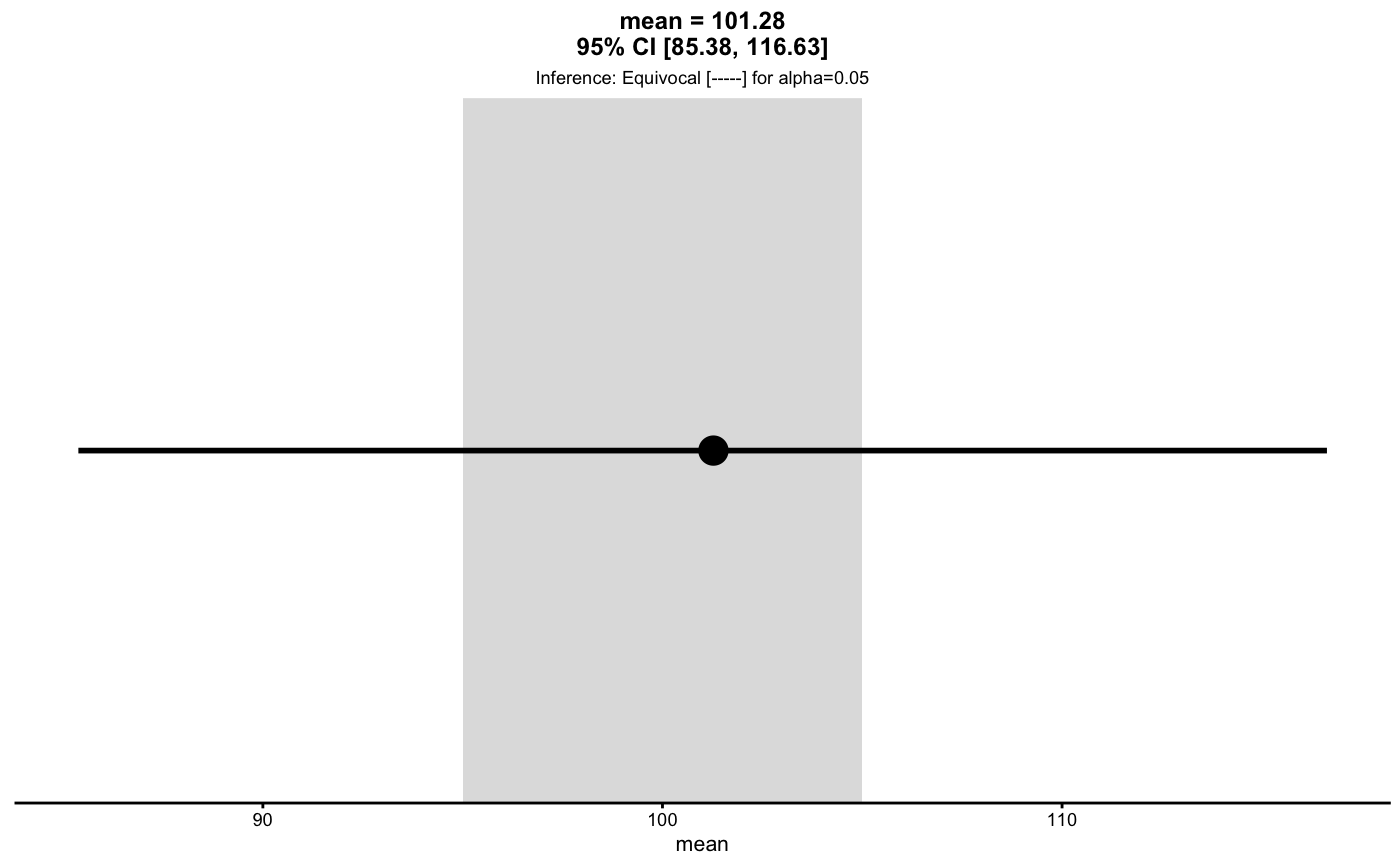
Examples
mean_MET <- bootstrap_MET( describe_data(rnorm(10, 100, 20)), estimator = "mean", SESOI_lower = 95, SESOI_upper = 105, alpha = 0.05 )#>#>#> Warning: extreme order statistics used as endpoints#> Warning: boot::boot.ci returned error or NULL when estimating CIs for min estimator. Returning NAs for upper and lower CIs#>mean_MET#> Minimum effect tests for the `mean` estimator #> Bootstrap result: mean=101.275, 95% CI [85.383, 116.629] #> SESOI: [95, 105], alpha=0.05 #> #> Test p.value #> inferiority 0.7725 #> non-superiority 0.3180 #> equivalence 0.3180 #> non-inferiority 0.2275 #> superiority 0.6820 #> #> Final inference: Equivocalplot(mean_MET)