Calculates proportion of the estimator bootstrap resample lower/equivalent/higher distribution compared to SESOI band
bootstrap_MBI(bmbstats_object, estimator, SESOI_lower = 0, SESOI_upper = 0)
Arguments
| bmbstats_object | Object of class |
|---|---|
| estimator | Name of the estimator from the |
| SESOI_lower | Lower smallest effect size of interest threshold |
| SESOI_upper | Upper smallest effect size of interest threshold |
Value
bmbstats_MBI object
Examples
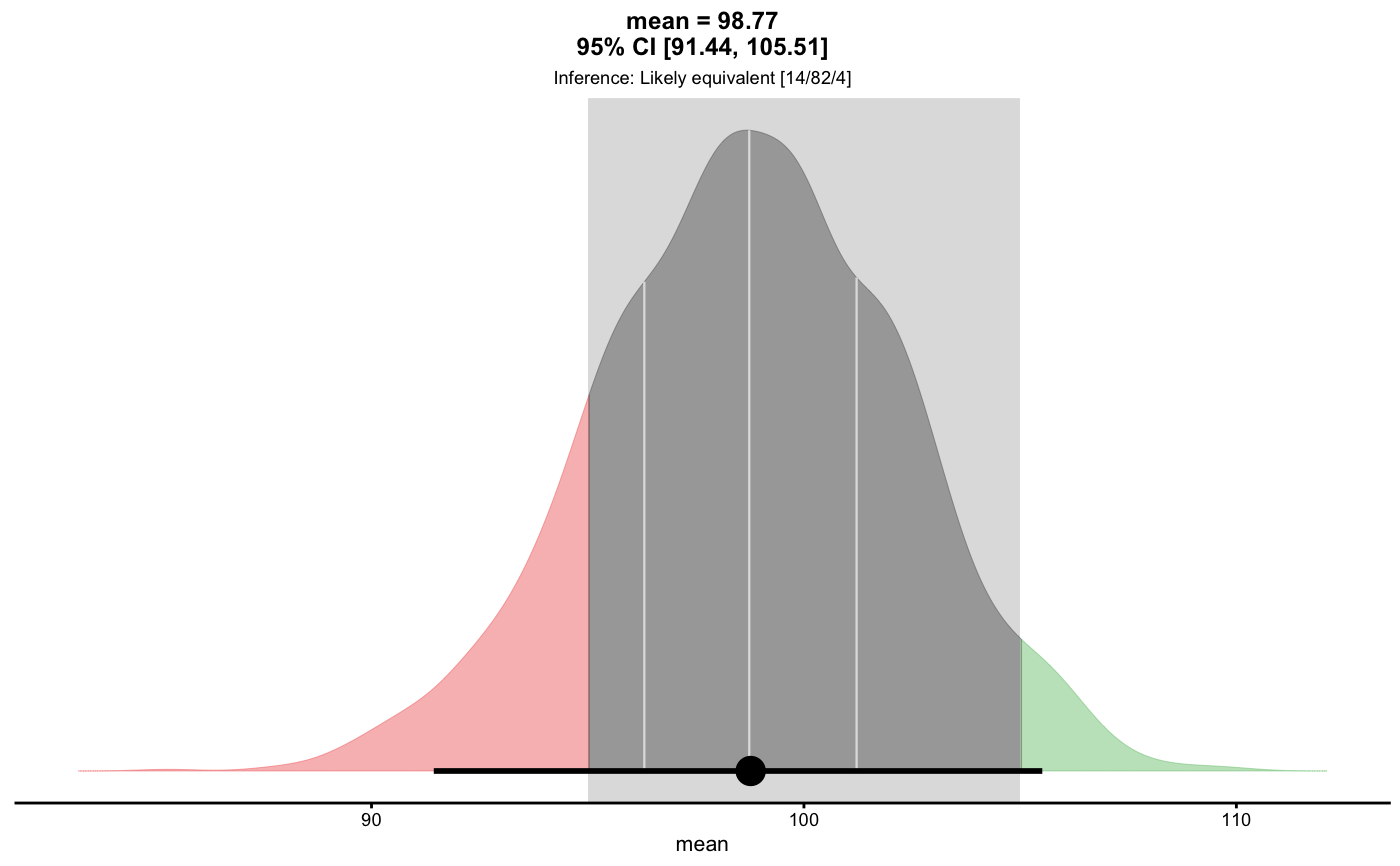
mean_MBI <- bootstrap_MBI( describe_data(rnorm(10, 100, 20)), estimator = "mean", SESOI_lower = 95, SESOI_upper = 105 )#>#>#> Warning: extreme order statistics used as endpoints#> Warning: extreme order statistics used as endpoints#> Warning: boot::boot.ci returned error or NULL when estimating CIs for min estimator. Returning NAs for upper and lower CIs#>mean_MBI#> Magnitude-based inference for the `mean` estimator #> Bootstrap result: mean=98.768, 95% CI [91.44, 105.512] #> SESOI: [95, 105] #> #> Test prob #> lower 0.1390 #> equivalent 0.8225 #> higher 0.0385 #> #> Final inference: Likely equivalent#>